
Image
|
Figure Caption
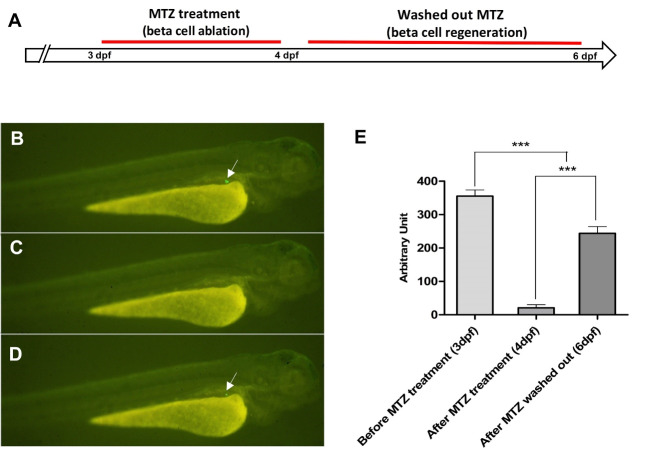
Fig. 3
MTZ treatment specifically depletes beta cells of and beta cell regeneration. A: Schematic diagram for cell-labeling and assessment of beta cell regeneration. B: Before MTZ treatment (3dpf). C: After 24 hrs MTZ treatment (4dpf) ablate the beta cells. D: Expression of EGFP appeared again after 2-day MTZ withdrawal (6dpf). Arrows show the beta cells. E: Quantitative analysis GFP intensities at 3 dpf, 4 dpf, and 6 dpf (n=5). ***P<0.001.
Figure Data
Acknowledgments
This image is the copyrighted work of the attributed author or publisher, and
ZFIN has permission only to display this image to its users.
Additional permissions should be obtained from the applicable author or publisher of the image.
Full text @ Galen med. j.