IMAGE

FIGURE 1

ID
ZDB-IMAGE-221004-16
Source
Figures for Lee et al., 2022
Image
Figure Caption

FIGURE 1

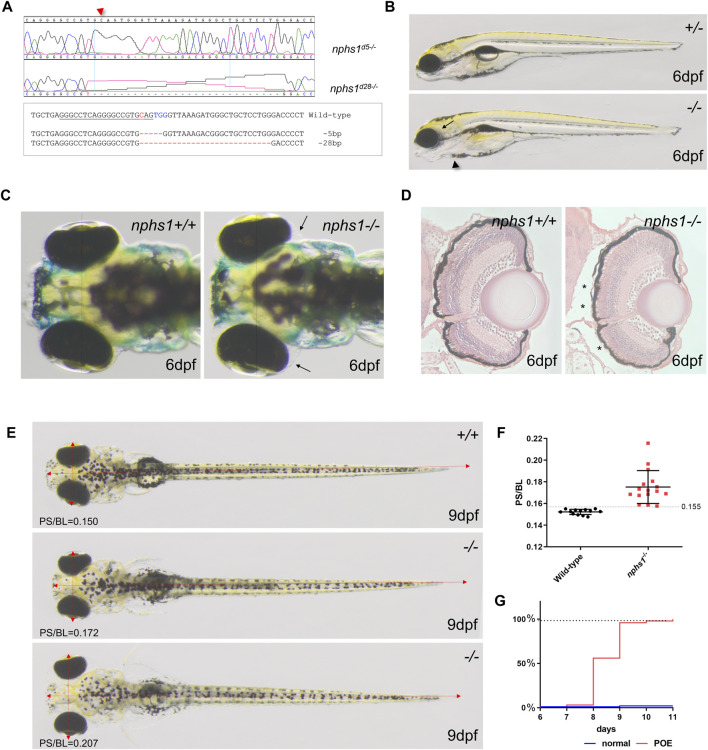
Generation of nphs1 mutant zebrafish by CRISPR/Cas9-mediated gene editing. (A) Sanger sequencing of the two different nphs1 mutant alleles. Sequence alignment of two nphs1 mutant alleles compared to the wild-type nphs1 gene sequence. PAMs are shown in blue color and sgRNA target sequence is underlined. The DNA break site by Cas9 is indicated red. (B) Morphological phenotype of nphs1 mutant at 6 dpf. The nphs1 mutant exhibited peri-orbital edema (arrow) and mild pericardial edema (arrowhead). (C) Dorsal view of the head region of zebrafish larvae. The nphs1 mutants exhibit peri-orbital edema (arrows) compared to wild-type siblings at 6 dpf. (D) Cross sections of periorbital region in wild-type and nphs1 mutants at 6 dpf. H&E staining shows the severity of peri-orbital edema (asterisks). (E) nphs1-/- develops severe periorbital and whole-body edema at 9 dpf compared to wild-type siblings. Red arrows indicate the pupil spacing distance (PS) and the body length (BL). (F) Scatter plot showing measurement of PS/BL in nphs1 mutants at 9 dpf. Each data point represents an individual larva and lines indicate the mean values. The error bars show the standard error of the mean (SEM). (G) Progression of the peri-orbital edema in nphs1 mutants (red line) and wild-type controls at 6–11 dpf.

Figure Data
Acknowledgments
This image is the copyrighted work of the attributed author or publisher, and ZFIN has permission only to display this image to its users. Additional permissions should be obtained from the applicable author or publisher of the image. Full text @ Front Cell Dev Biol