
|
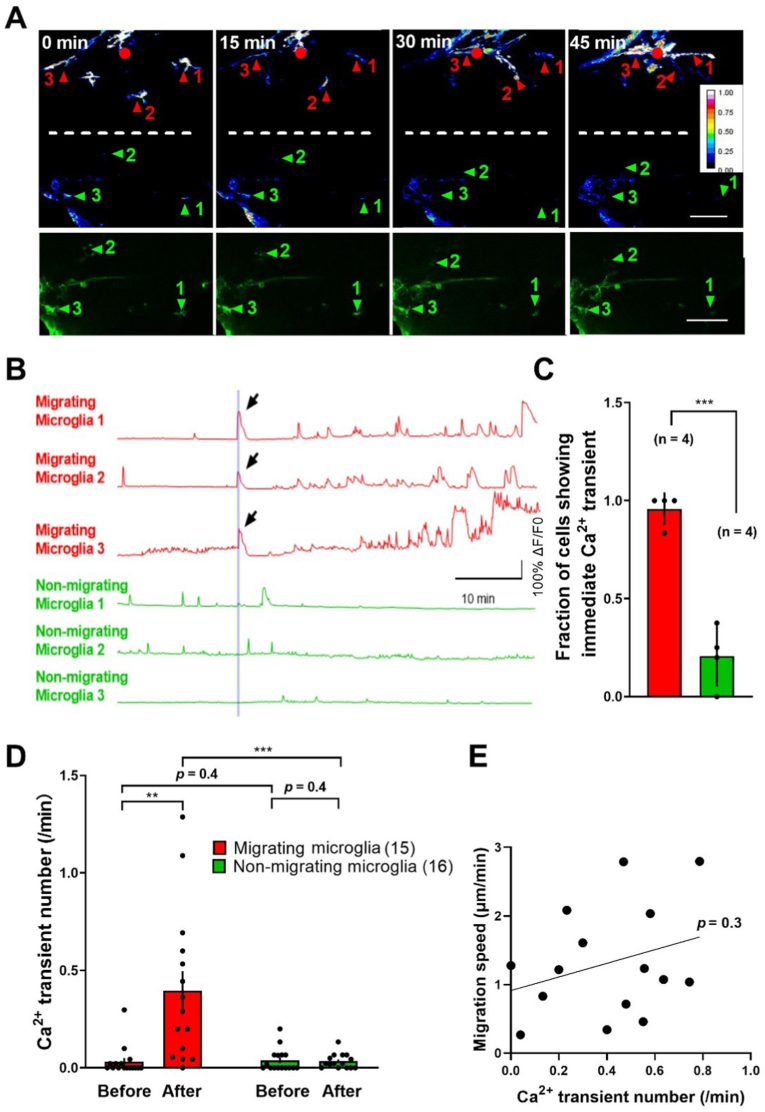
Fig. 2
Association between the Ca2+ activity and migration of activated microglia.
**p < 0.01, ***p < 0.001 (unpaired Student's t-test for (C) and for comparison between migrating and non-migrating microglia in (D), paired Student's t-test for comparison within migrating or non-migrating microglia in (D)). Error bars, SEM.
(A) Up, in vivo time-lapse two-photon images showing Ca2+ activities (in heatmaps) accompanying with microglia migration induced by laser-based local brain injury (red dot) at time 0. The data were obtained from the same larvae with that in Fig. 1B. Red numbers and arrowheads, microglia responsive to the injury; green numbers and arrowheads, microglia located in the contralateral hemisphere and non-responsive to the injury. Dashed white lines represent the midline between two hemispheres. Down, raw images showing the morphology of non-responsive microglia in the contralateral hemisphere. Scale bar, 50 μm
(B) Traces of Ca2+ activities of microglia numbered in (A). The vertical line indicates the onset of local brain injury. Arrow, immediate Ca2+ transient induced by the injury.
(C) Summary of the fraction of cells showing injury-induced immediate Ca2+ transient for the migrating (red) and non-migrating (green) microglia. Data were collected from 31 microglial cells in 4 zebrafish larvae, and each dot on the bar represents the data from an individual larva.
(D) Summary of injury-induced later Ca2+ transient number per minute before and after the local injury in migrating (red) and non-migrating (green) microglia. The number in the brackets represents the number of microglia examined, and each dot on the bar represents the data from an individual microglial cell. Data were collected from 31 microglial cells in 4 zebrafish larvae.
(E) Association between Ca2+ transient number per minute and migration speed before microglia stop moving on the injury site. The black linear line represents the simple linear regression slope (Y = 0.9932*X + 0.9130). Each dot on the graph represents the data from an individual microglial cell. Data were collected from 31 microglial cells in 4 zebrafish larvae. . (For interpretation of the references to colour in this figure legend, the reader is referred to the Web version of this article.)