
Image
|
Figure Caption
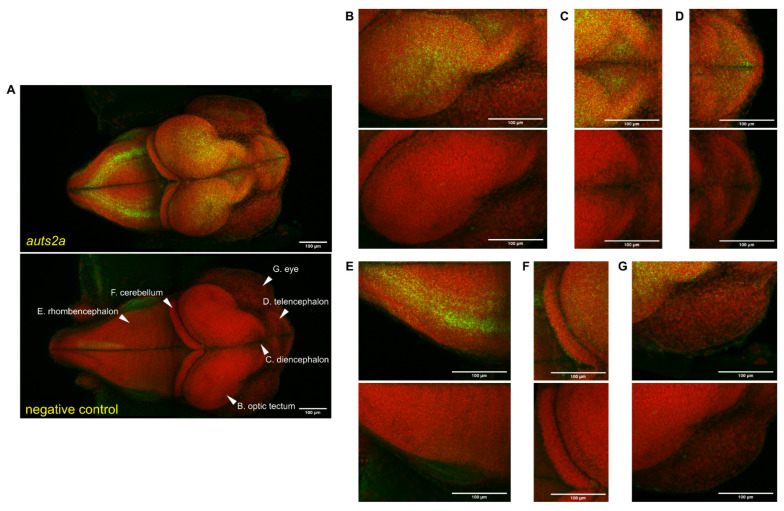
Fig. 6
auts2a spatial expression in stage 29 medaka whole embryos using RNAscope. Green staining corresponds to the RNAscope signal. Red staining corresponds to the methyl-green-stained cell nucleus. An RNAscope probe targeting the Bacillus subtilis dapB gene (Accession #: EF191515) was used as a negative control. Images correspond to a maximum intensity Z axis projection for the RNAscope probe and standard deviation Z axis projection for methyl green. (A). Whole embryo. (B). Optic tectum. (C). Diencephalon. (D). Telencephalon. (E). Rhombencephalon. (F). Cerebellum. (G). Eyes.
Acknowledgments
This image is the copyrighted work of the attributed author or publisher, and
ZFIN has permission only to display this image to its users.
Additional permissions should be obtained from the applicable author or publisher of the image.
Full text @ Cells