
|
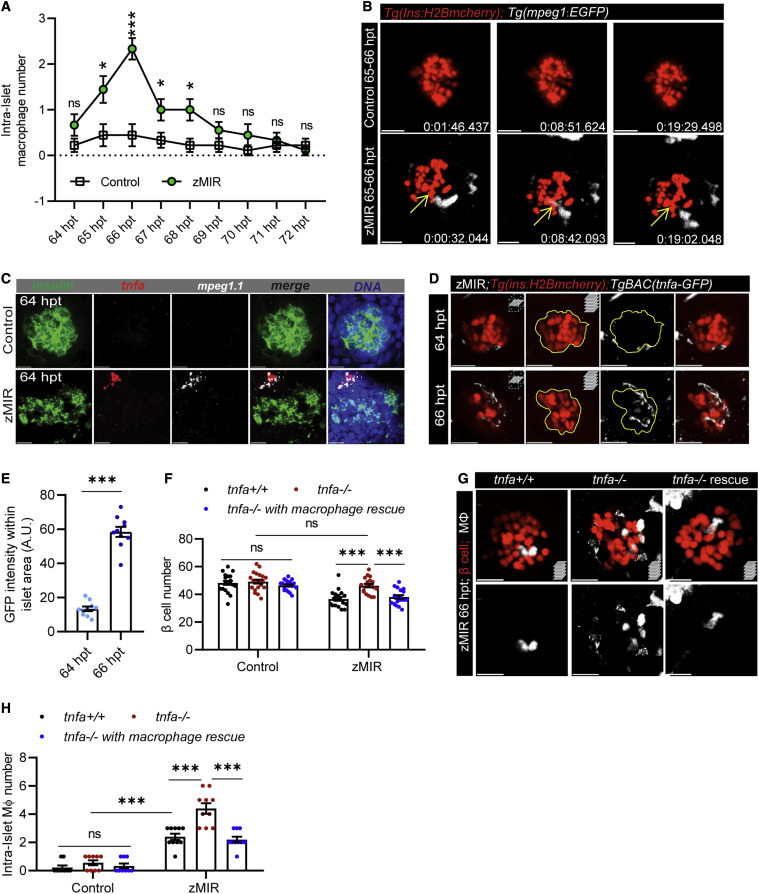
Fig. 2 Figure 2. Macrophage-derived Tnfa is necessary for β cell loss in zMIR fish (A) Intra-islet macrophage number in zMIR fish from 64–72 h based on 30 s/frame time-lapse videos hourly. Data represent means ± SEM, n ≥ 10 per group, multiple t tests; ∗p < 0.05, ∗∗∗p < 0.001. (B) Macrophage surveillance of the principal islet during 65–66 hpt in zMIR and control fish, showing that macrophage-contacted β cells remained intact. Live imaging videos were recorded at 30-s intervals. Yellow arrows indicate a macrophage-contacted β cell. Scale bars, 20 μm. (C) Representative RNAscope images of insulin, mpeg1.1, tnfa expression at 64 h in control and zMIR fish. Scale bars, 20 μm. (D) Islet images of TgBAC(tnfa:GFP), Tg(ins:H2B-mCherry), zMIR fish at 64 and 66 h. The GFP signal was detected by immunofluorescence. Scale bars, 20 μm. (E) Quantification of GFP signals in the islet area (outline in D). Data are mean ± SEM, n = 10/group, unpaired t test; bar graphs represent mean ± SEM; ∗∗∗p < 0.001. (F) The effect of tnfa re-expression in macrophages on β cell loss in zMIR fish. Data are mean ± SEM, n > 15/group, two-way ANOVA followed by Tukey’s multiple comparisons test; ∗∗∗p < 0.001. (G) Representative images showing increased intra-islet macrophages in zMIR fish with different tnfa genotypes (+/+, −/−, and −/− with macrophage rescue). Red marks β cells, and white labels macrophages. Scale bars, 10 μm. (H) Quantification of intra-islet macrophages in zMIR fish with different tnfa genotypes (+/+, −/−, and −/− with macrophage rescue) at 66 hpt. Data are mean ± SEM, n = 10 per group, two-way ANOVA followed by Tukey’s multiple comparisons test; ∗∗∗p < 0.001.