
Image
|
Figure Caption
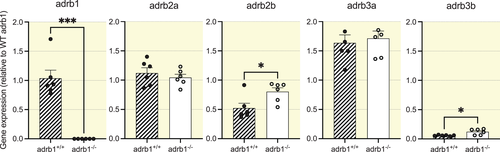
Fig. 7
Expression of five adrb genes in 7 dpf adrb1+/+ and adrb1−/− zebrafish hearts analyzed with qPCR. Statistical comparisons made with unpaired t-test. *p < 0.05; ***p < 0.001. For each sample N = 6 pools of 20 hearts. Bars show means ± SEM and individual data points.
Acknowledgments
This image is the copyrighted work of the attributed author or publisher, and
ZFIN has permission only to display this image to its users.
Additional permissions should be obtained from the applicable author or publisher of the image.
Full text @ Acta Physiol. (Oxf).