
Image
|
Figure Caption
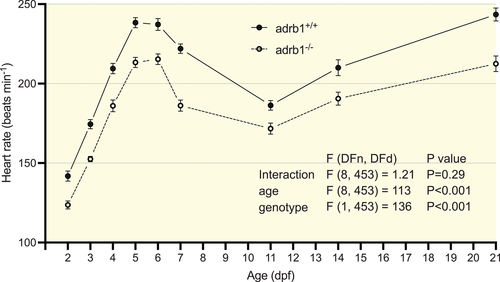
Fig. 2
Heart rate during development in unanesthetized adrb1+/+ and adrb1−/− larvae. Heart rates were optically measured from 2–21 days post-fertilization (dpf). Each individual larva was used at only one time point. Statistical results show the output of a two-way ANOVA. N values were 16–55 at each time point. Data points show means ± SEM.
Acknowledgments
This image is the copyrighted work of the attributed author or publisher, and
ZFIN has permission only to display this image to its users.
Additional permissions should be obtained from the applicable author or publisher of the image.
Full text @ Acta Physiol. (Oxf).