
|
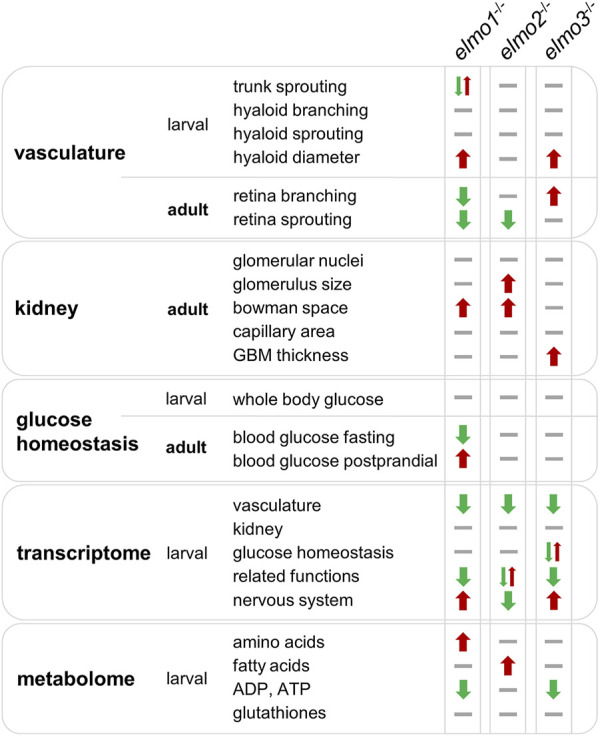
Fig. 8
Comparison of elmo1 −/− , elmo2 −/− and elmo3 −/− phenotype in zebrafish indicates different functions of Elmo1, Elmo2 and Elmo3. Overview and comparison of the results of the phenotypical analysis of elmo1 −/− , elmo2 −/− and elmo3 −/− zebrafish in larval and adult stages indicate that Elmo1, Elmo2 and Elmo3 have not the same role in the regulation of the organism. Listed are all fields which were analyzed in this study and their outcome in the specific zebrafish line. Results are visualized with arrows and bars. Arrow up (red) indicates an increase, arrow down (green) indicates a decrease, one arrow up and one arrow down at once indicate different changes, bar (grey) indicates no change. GBM, glomerular basement membrane.