
|
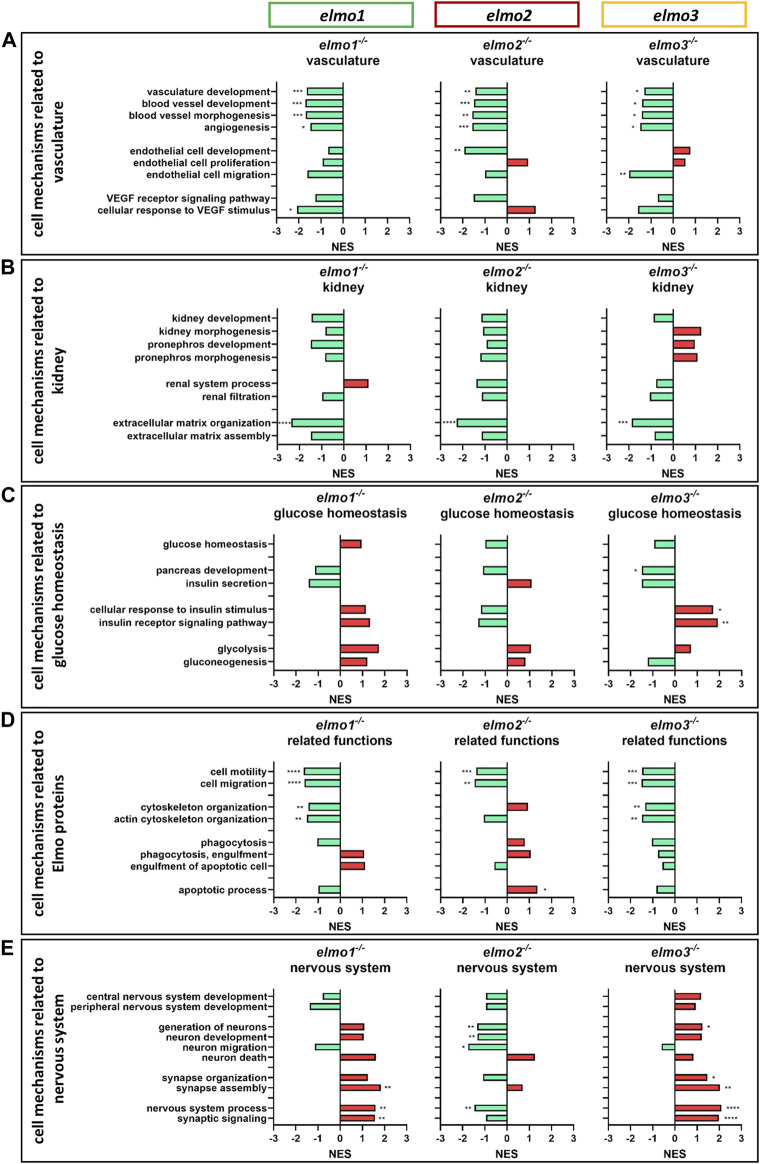
Fig. 7
The loss of Elmo1, Elmo2 and Elmo3 led to similar and different changes in the regulation of the transcriptome in larval zebrafish. Comparison of the regulation of cell mechanisms in elmo1 −/− , elmo2 −/− and elmo3 −/− zebrafish larvae, respectively, compared to elmo1 +/+ , elmo2 +/+ and elmo3 +/+ . Gene Ontology Biological Process (GOBP) based analysis of cell mechanisms of the transcriptome using RNA-sequencing data from zebrafish larvae at 120 hpf. n = 6 samples per genotype, each containing 30 zebrafish larvae. Regulation of the gene sets is given as normalized enrichment score (NES). (A) Cell mechanisms related to vascular development were generally downregulated in elmo1 −/− , elmo2 −/− and elmo3 −/− . (B) Cell mechanisms related to kidney development and function showed a downregulation of extracellular matrix organization in elmo1 −/− , elmo2 −/− and elmo3 −/− . (C) Cell mechanisms related to glucose homeostasis were differently regulated in elmo3 −/− . (D) Cell mechanisms related to further functions of Elmo proteins showed a general downregulation in elmo1 −/− and elmo3 −/− and different changes in elmo2 −/− . (E) Cell mechanisms related to the nervous system were generally upregulated in elmo1 −/− and elmo3 −/− and downregulated in elmo2 −/− . hpf, hours post fertilization; NES, normalized enrichment score.