
|
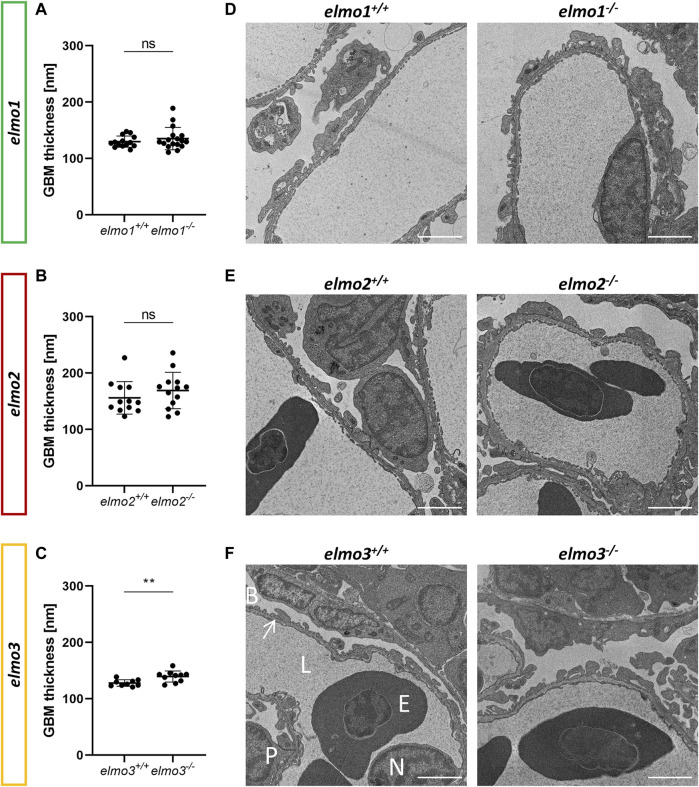
Fig. 5
The loss of Elmo3 led to a thickening of the glomerular basement membrane in adult zebrafish kidneys. (A) Quantification of the thickness of the GBM in the adult kidney (9–15 mpf) showed no alterations in elmo1 −/− compared to littermate elmo1 +/+ . n = 14–17 per group. Each is the mean thickness per one glomerulus. (B) Quantification of the thickness of the GBM in the adult kidney showed no alterations in elmo2 −/− compared to littermate elmo2 +/+ . n = 12–13 per group. Each is the mean thickness per one glomerulus. (C) Quantification of the thickness of the GBM in the adult kidney showed an increase of the GBM thickness in elmo3 −/− compared to littermate elmo3 +/+ . n = 9–10 per group. Each is the mean thickness per one glomerulus (D–F) Representative electron microscopy images of glomerulus sections of adult zebrafish kidneys of elmo1 +/+ and elmo1 −/− (D), elmo2 +/+ and elmo2 −/− (E) and elmo3 +/+ and elmo3 −/− (F). Exemplarily glomerulus compartments as GBM (arrow), Bowman space (B), endothelial cell nucleus (N), capillary lumen (L), podocyte (P) and erythrocyte (E) are indicated in white. Scale bar is 2 µm. Statistical analysis was done with t-test and Mann-Whitney test. **p < 0.01. ns, not significant; GBM, glomerular basement membrane; mpf, months post fertilization.