
|
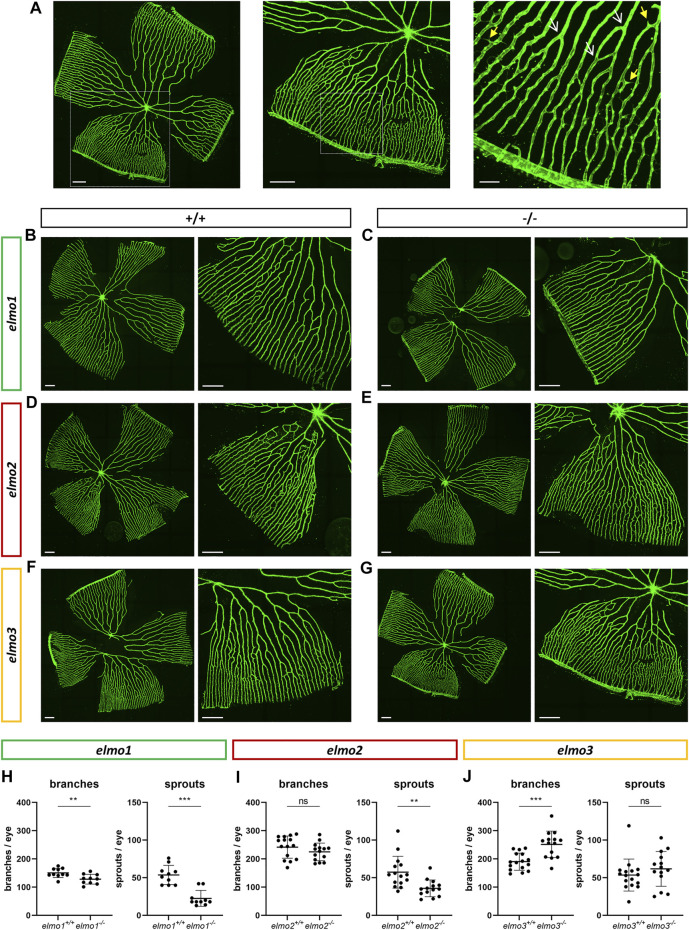
Fig. 3
Different regulation of the retinal vasculature through Elmo1, Elmo2 and Elmo3 in adult zebrafish. (A) Exemplary pictures of a confocal scan of an adult zebrafish retinal vasculature. White squares each indicate the section of the image on the right. Scale bars are 200 µm (left, middle) and 50 µm (right). Representative vascular branches are indicated with a yellow arrow with a full arrowhead and sprouts are indicated with a white arrow with an open arrowhead. (B–G) Representative confocal microscopy images of the retina vasculature of elmo1 +/+ (B) and elmo1 −/− (C), elmo2 +/+ (D) and elmo2 −/− (E) and elmo3 +/+ (F) and elmo3 −/− (G) adult zebrafish. (H) Quantification of the adult retina vasculature showed a decrease in branches and sprouts in elmo1 −/− compared to elmo1 +/+ . n = 10 retinae per group. (I) Quantification of the adult retina vasculature showed no changes in branches and a decrease in sprouts in elmo2 −/− compared to elmo2 +/+ . n = 14–15 retinae per group. (J) Quantification of the adult retina vasculature showed an increase in branches and no changes in sprouts in elmo3 −/− compared to elmo3 +/+ . n = 14–16 retinae per group. Analyzed retinae were obtained from animals of 9–15 mpf. Scale bar is 200 µm. Statistical analysis was done with t-test and Mann-Whitney test. **p < 0.01, ***p < 0.001. ns, not significant; mpf, months post fertilization.