IMAGE

FIGURE 1

ID
ZDB-IMAGE-220722-9
Source
Figures for Godivier et al., 2022
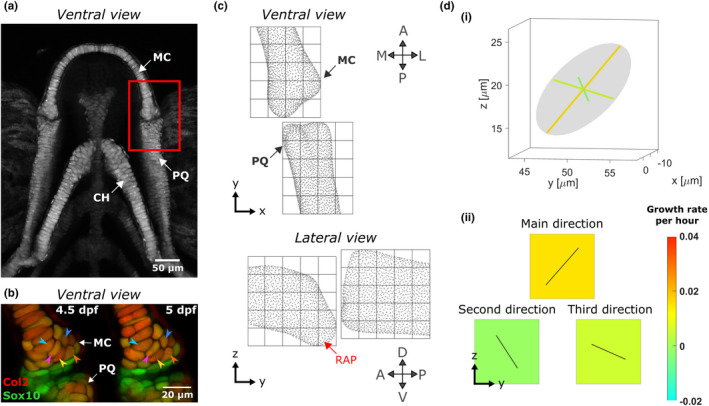
Image
Figure Caption

FIGURE 1

Growth map calculations in larval zebrafish jaw joint. (a) Maximum projection of ventral confocal image stacks of the jaw from a larval zebrafish aged 5 dpf expressing Tg(Col2a1aBAC:Mcherry) cartilage marker; red box shows the jaw joint for which morphogenesis is characterised in this study. (b) Representative ventral stacks of the anterior jaw joint element of a live specimen aged 4.5 and 5 dpf expressing the transgenic reporters Col2a1aBAC:Mcherry (red) and −4.9sox10:eGFP (green) marking cartilage in which cells can visually be identified over time. A few cells were marked by arrows as examples. Green cells are sox10+ve and col2‐ve and therefore less differentiated than the more mature yellow cells co‐expressing the two transgenes and which form the cartilaginous joint elements. (c) A grid marks out the regions (ROIs) of the anterior MC and posterior PQ joint elements in which growth is characterised. Each cube side length is 15 μm. (d) (i) The growth rate calculated for each ROI is represented by an ellipsoid with orthogonal axes. (ii) The ellipsoid's radii and the orientation of its axes are used to generate a growth map for each of the ellipsoid's radii in the lateral plane; growth rate is represented by the square's colour, while the direction of growth is shown by solid black lines in the corresponding square. A, anterior; CH, ceratohyal; D, dorsal; L, lateral; M, medial; MC, Meckel's cartilage; P, posterior; PQ, palatoquadrate; RAP, retroarticular process; V, ventral

Acknowledgments
This image is the copyrighted work of the attributed author or publisher, and ZFIN has permission only to display this image to its users. Additional permissions should be obtained from the applicable author or publisher of the image. Full text @ J. Anat.