IMAGE

FIGURE 6

ID
ZDB-IMAGE-220722-1
Source
Figures for Godivier et al., 2022
Image
Figure Caption

FIGURE 6

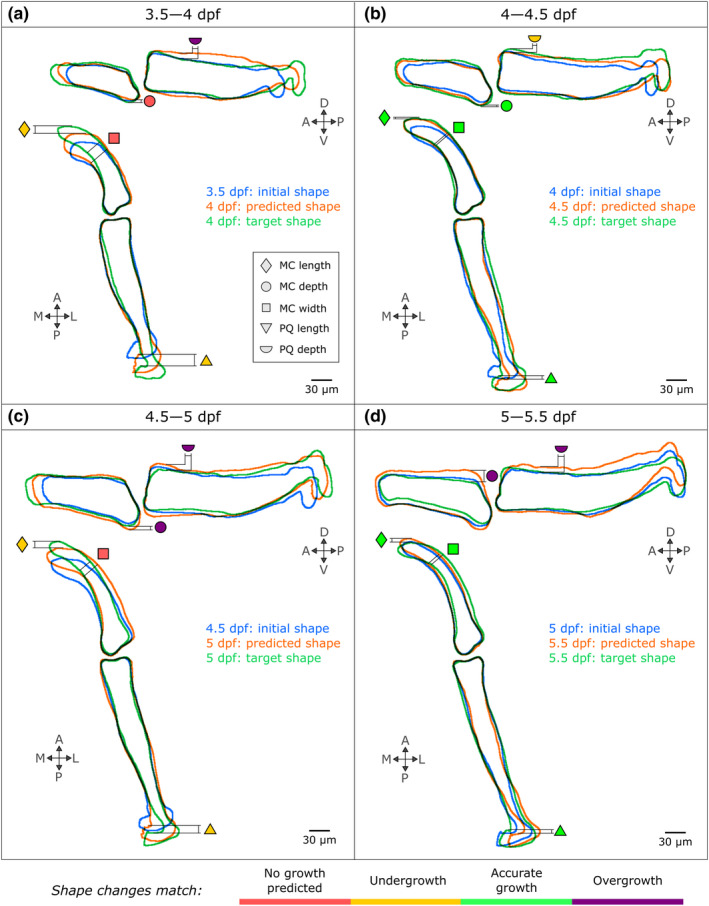
The integration of cell‐based data in an FE model successfully predicts zebrafish jaw shape changes from 3.5 to 5.5 dpf, with most faithful predictions from 4 to 4.5 dpf. The shape outlines for each time window are superimposed (blue: Initial shape, green: Target shape, orange: Predicted shape) and the shapes features introduced in Figure 3 are compared (triangle: Palatoquadrate (PQ) length, diamond: Meckel's cartilage (MC) length, square: MC width, semi‐circle: PQ depth, circle: MC depth) and rated with a colour code explained in the bottom panel (red means no growth predicted, yellow means undergrowth though the pattern of change is correct, green means accurate shape changes and violet means overgrowth though the pattern of change is correct). A, anterior; D, dorsal; L, lateral; M, medial; P, posterior; V, ventral

Acknowledgments
This image is the copyrighted work of the attributed author or publisher, and ZFIN has permission only to display this image to its users. Additional permissions should be obtained from the applicable author or publisher of the image. Full text @ J. Anat.