IMAGE

Fig. 1.

ID
ZDB-IMAGE-220717-100
Source
Figures for Ross et al., 2021
Image
Figure Caption

Fig. 1.

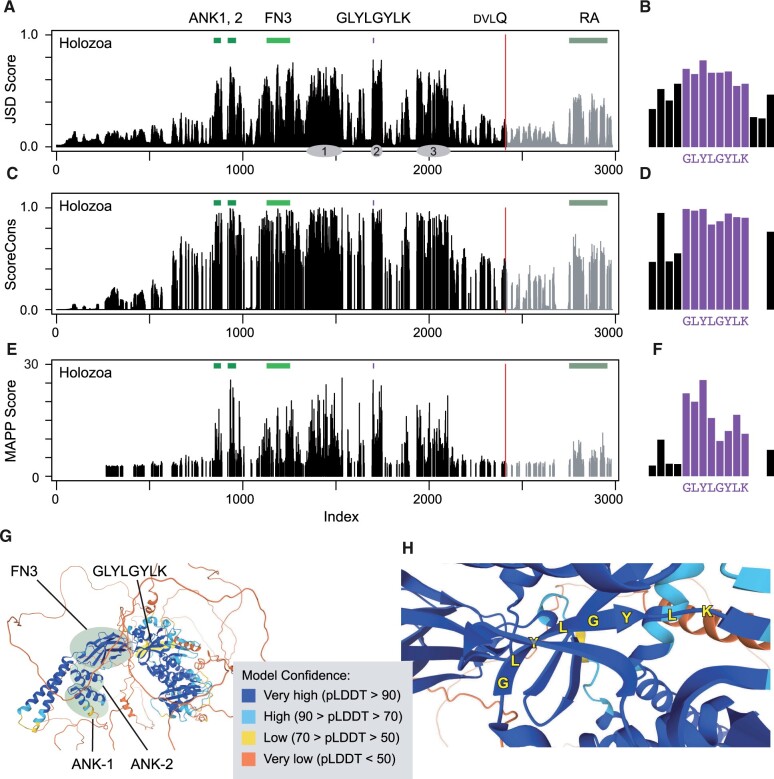
Conserved features of Ankfn1 homologs. For each histogram a–f) a higher bar indicates higher conservation or constraint at a single residue site for an alignment of Holozoan ANKFN1 proteins. a) Jensen–Shannon divergence (JSD) scores standardized to a range of zero to one. Colored bars above the histogram indicate the positions of the two ANK repeats (ANK1, 2) and FN3 domains, the conserved GLYLGYLK peptide, and the RA domain of ancestral paralogs. A vertebrate-conserved DVLQ peptide (red line) marks the carboxyterminal extent of homology between ancestral and derived paralogs. Gray ovals indicate approximate positions of the three conserved nonmotif regions of Zhang et al. (2015). b) JSD scores at the conserved peptide, y-axis same as (a). c) ScoreCons residue conservation using Valdar’s scoring method. d) ScoreCons scores at the conserved peptide, y-axis same as (c). e) MAPP median score for substitution at each site. f) MAPP scores at the conserved peptide, y-axis same as (e). g) AlphaFold2-predicted structure for mouse ANKFN1 protein, showing positions of the ANK, FN, and GLYLGYLK (yellow highlight) regions and confidence scores. h) Detailed view of the structure in (g) showing the predicted GLYLGY beta strand in relation to flanking strands.

Acknowledgments
This image is the copyrighted work of the attributed author or publisher, and ZFIN has permission only to display this image to its users. Additional permissions should be obtained from the applicable author or publisher of the image. Full text @ G3 (Bethesda)