
|
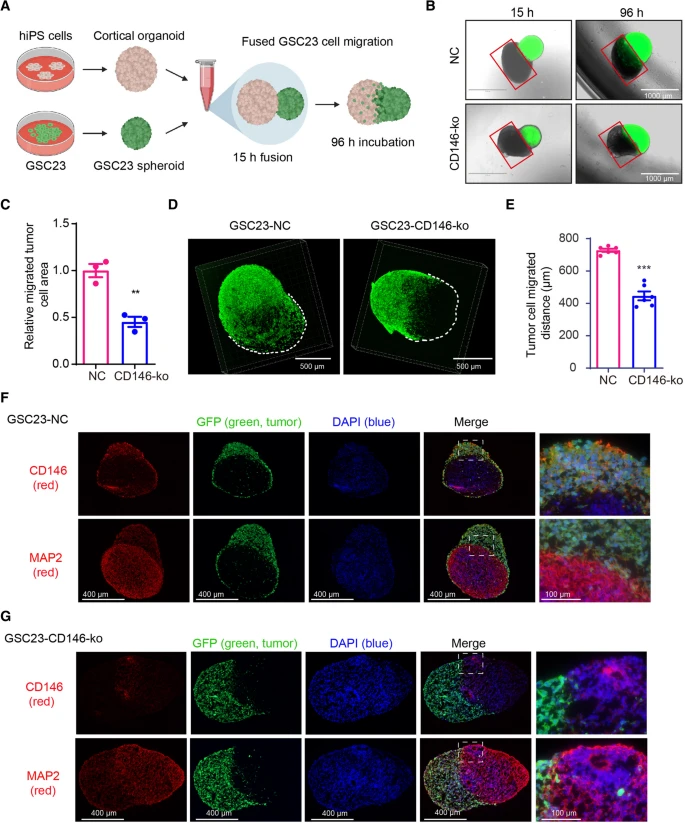
Fig. 3
GSC23-CD146 knockout cells have reduced migration/invasion capacity in a GBM-cortical assembloid model. A Schematic outline of the generation of GBM-cortical assembloids to determine migration and invasion capacity. B Representative fluorescent microscopic pictures of GSC23-NC (control) and GSC23-CD146-ko (green) GBM-cortical assembloids at different time points after fusion (scale bars = 1000 μm). The red squares indicate the organoid area largely negative for GFP positive cells, and were used to quantify migration/invasion of GSC23 cells (see methods). C Quantification of migration/invasion by determining ratios GFP positive vs. negative areas, indicating reduced migration/ invasion of GSC23 CD146-ko cells. D Representative confocal immunofluorescent microscopic 3D images of the neurosphere-cortical assembloids 4 days post-fusion. E Distance quantification of migrated GFP positive tumor cell in the GBM-cortical assembloid. Immunofluorescence microscopic images of GFP-labeled (green: GSC23 cells) GSC23 (F) and GSC23-CD146-ko GBM-cortical assembloids (G) stained for CD146 and the neuronal marker MAP2 (labeled red). Nuclei (blue) were stained with DAPI. Scale bars = 400 μm (left), scale bars = 100 μm (right). **p < 0.01, ***p < 0.001 by Student’s t test