
|
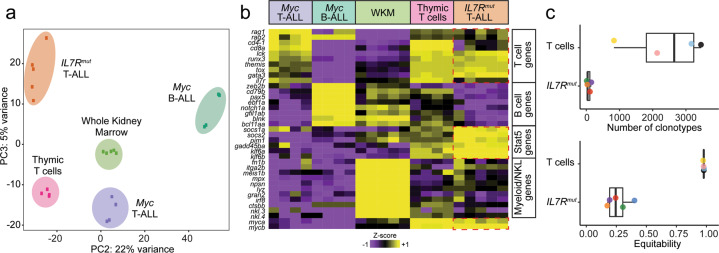
Fig. 2
a Principal component analysis (PCA) plot of gene expression profiles from RNA sequencing of different zebrafish leukemias and control samples. b Heatmap representation showing expression of well-known T-, B- and Myeloid/NKL-cell associated genes, as well as common STAT5 target genes (adj. P < 0.05). WKM, whole kidney marrow. c TCR-β gene rearrangements in T-ALLs from stable mutant IL7R zebrafish compared with normal thymocytes from control zebrafish. Shown as dotplots and boxplots are the number of clonotypes of the TRB locus and the equitability value per sample, both based on productive rearrangements. Higher number of clonotypes indicates higher polyclonality. Higher equitability means the relative frequency of the different clonotypes in a given sample is more balanced, whereas a lower equitability value indicates unbalanced frequencies (i.e. one or a few clones predominate over the others).