Fig. 4
Image
Figure Caption
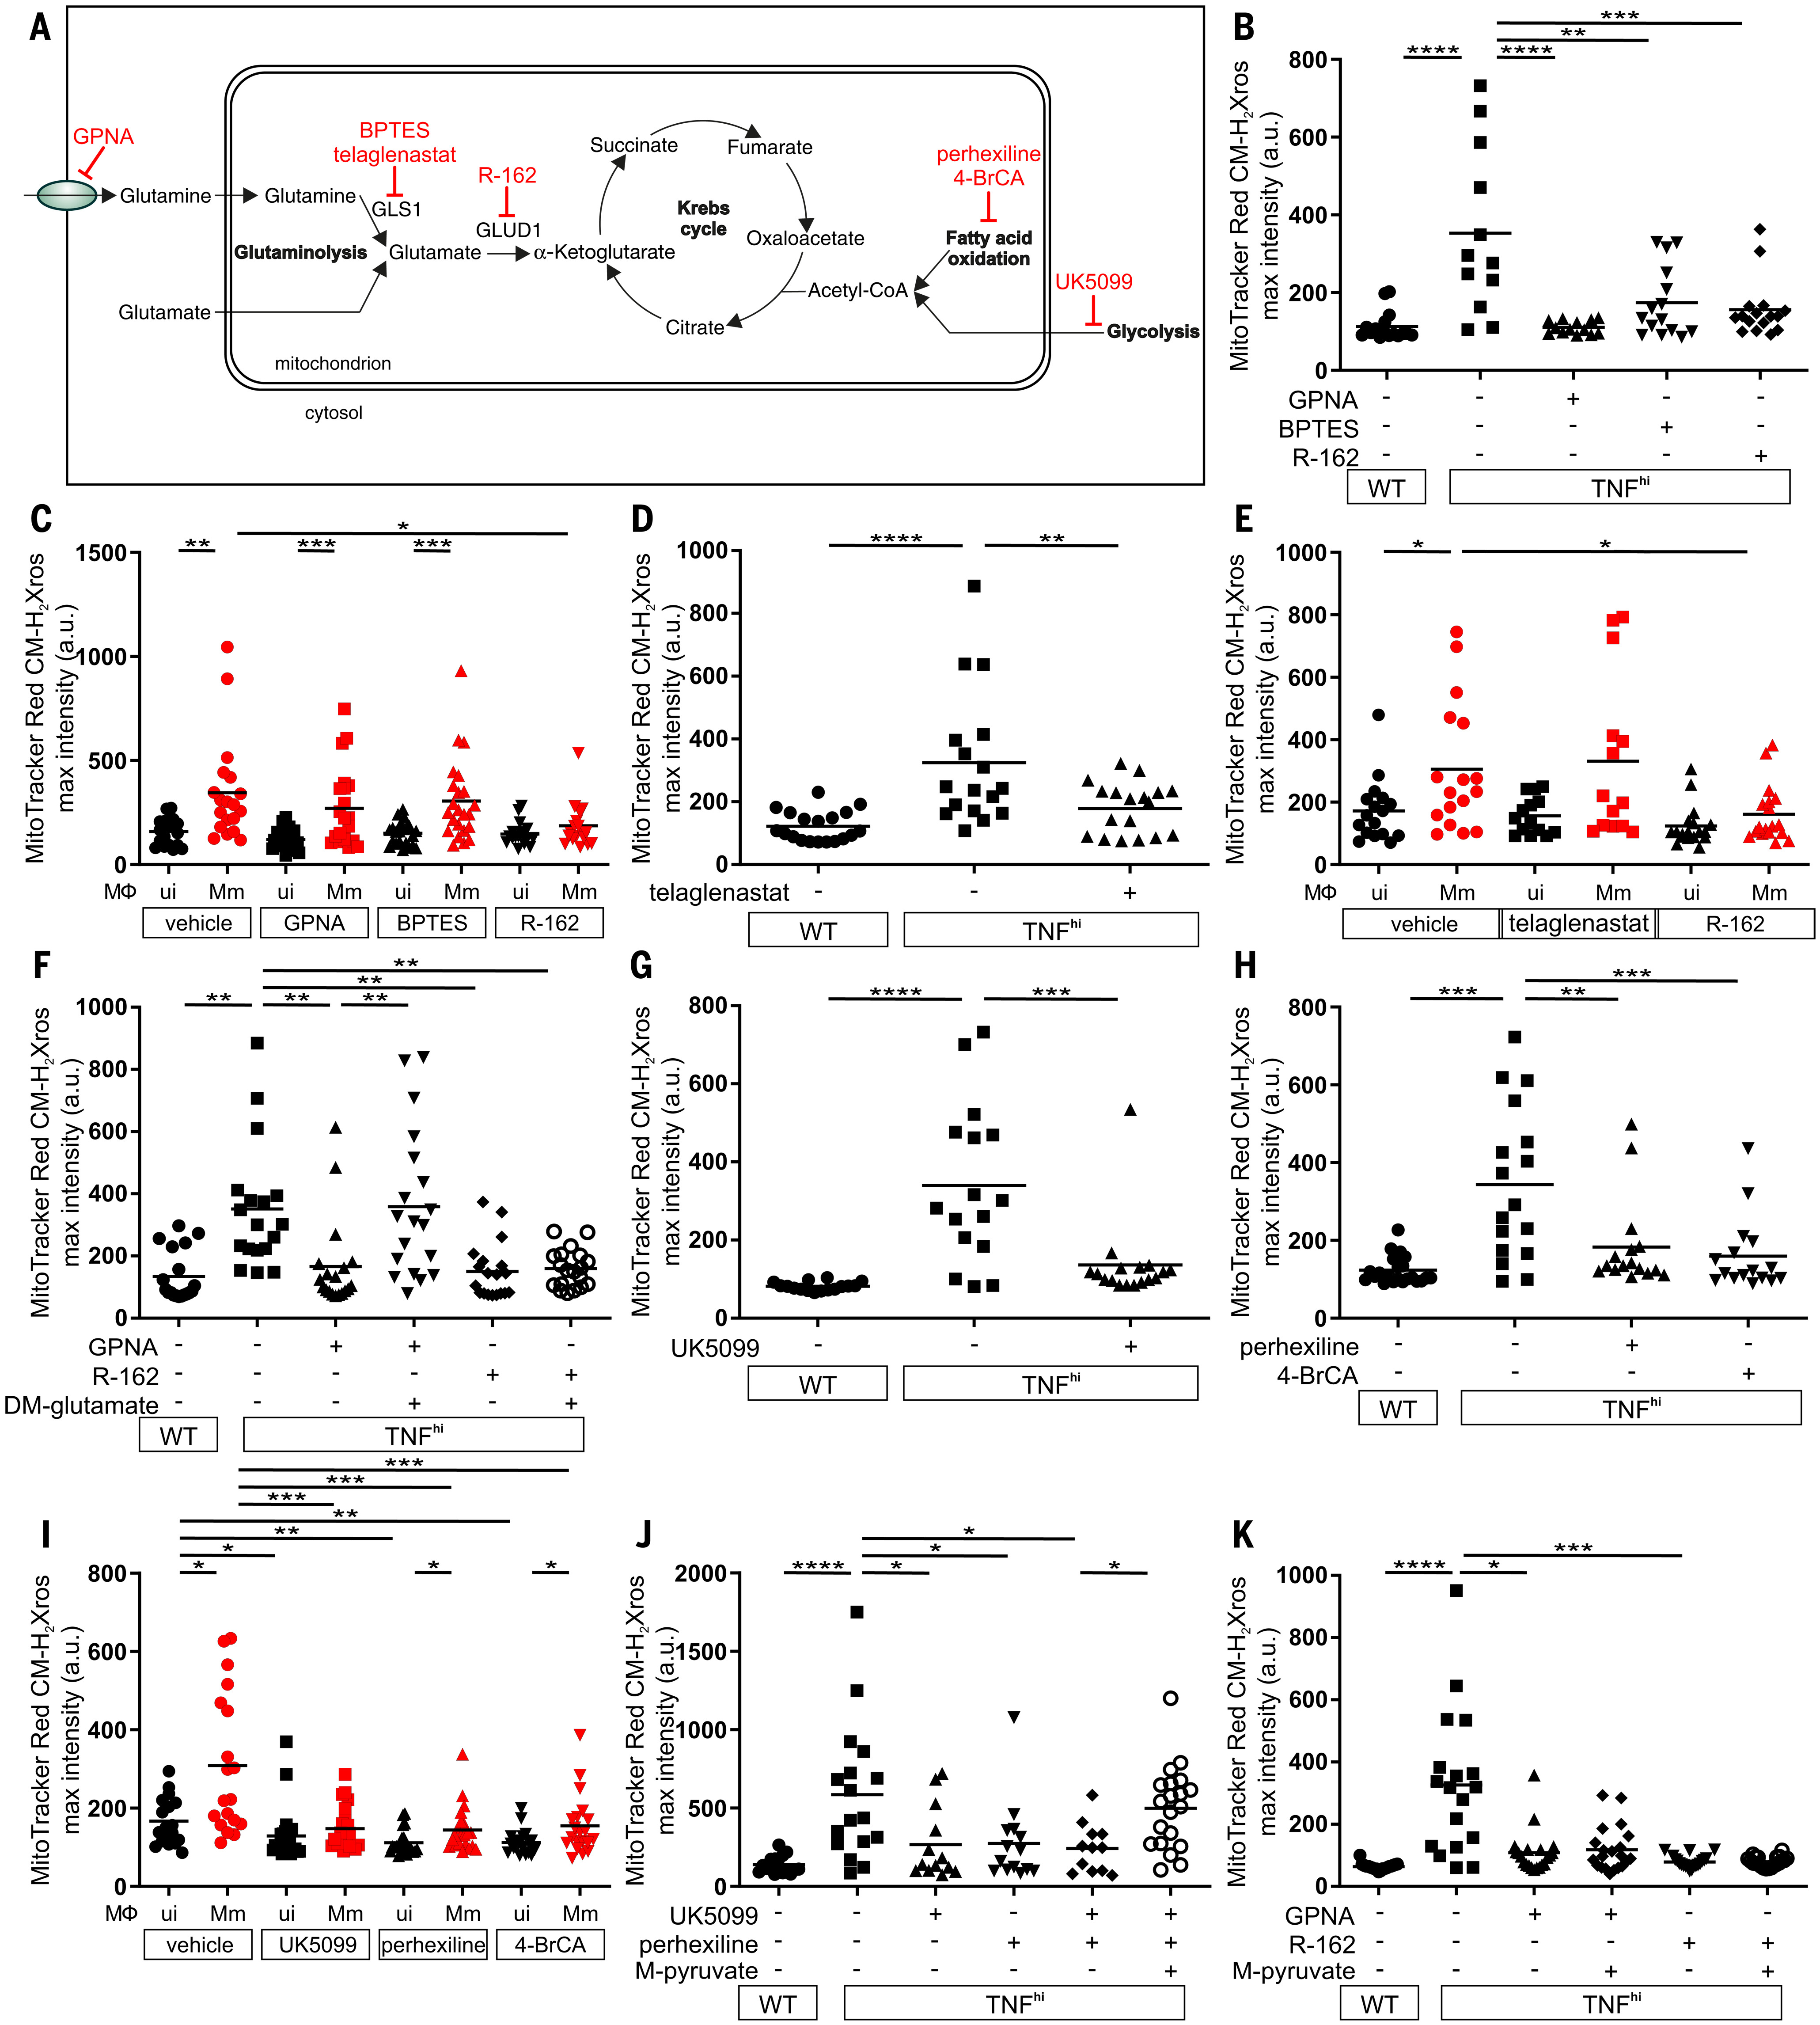
Fig. 4. TNF-induced glutamine cellular uptake and increased glutaminolysis is responsible for RET and mROS production in mycobacterium-infected macrophages.
(A) Illustration of main metabolic pathways fueling the Krebs cycle with inhibitors used (truncated red arrows). GLUD1, glutamate dehydrogenase 1. (B to K) Quantification of mROS in larvae 1 day after infection with Mm that are wild-type or TNFhi treated with GPNA, BPTES, R-162, or vehicle (B); wild-type treated with GPNA, BPTES, R-162, or vehicle (C); wild-type or TNFhi treated with telaglenastat or vehicle (D); wild-type treated with telaglenastat, R-162, or vehicle (E); wild-type or TNFhi treated with vehicle, or GPNA or R-162 alone or in combination with DM-glutamate (F); wild-type or TNFhi treated with UK5099 or vehicle (G); wild-type or TNFhi treated with perhexiline, 4-BrCA, or vehicle (H); wild-type treated with UK5099, perhexiline, 4-BrCA, or vehicle (I); wild-type or TNFhi treated with vehicle, or UK5099 or perhexiline alone or in combination with M-pyruvate (J); or GPNA or R-162 alone or in combination with M-pyruvate (K). Horizontal bars denote means; *P < 0.05, **P < 0.01, ***P < 0.001, ****P < 0.0001 [one-way ANOVA with Tukey’s post-test in (B), (D), (F) to (H), (J), and (K); Dunn’s post-test in (C), (E), and (I)]. Black and red symbols in (C), (E), and (I) represent uninfected (ui) and Mm-infected (Mm) macrophages, respectively, in the same animals. Data are representative of two or three independent experiments [(B) to (D), (G) to (I)] or a single experiment [(E), (F), (J), and (K)].
Acknowledgments
This image is the copyrighted work of the attributed author or publisher, and
ZFIN has permission only to display this image to its users.
Additional permissions should be obtained from the applicable author or publisher of the image.
Full text @ Science

