
Image
|
Figure Caption
Fig. 3
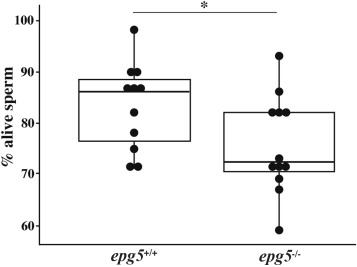
Fig. 3. Sperm viability in epg5+/+ (n = 11) and epg5−/− (n = 12) males. Viability is calculated as the percentage of alive sperm. Boxplots (first to third quartile) with median line and whiskers (1.5 interquartile range). ∗p < 0.05.
Figure Data
Acknowledgments
This image is the copyrighted work of the attributed author or publisher, and
ZFIN has permission only to display this image to its users.
Additional permissions should be obtained from the applicable author or publisher of the image.
Full text @ Biomed J