
|
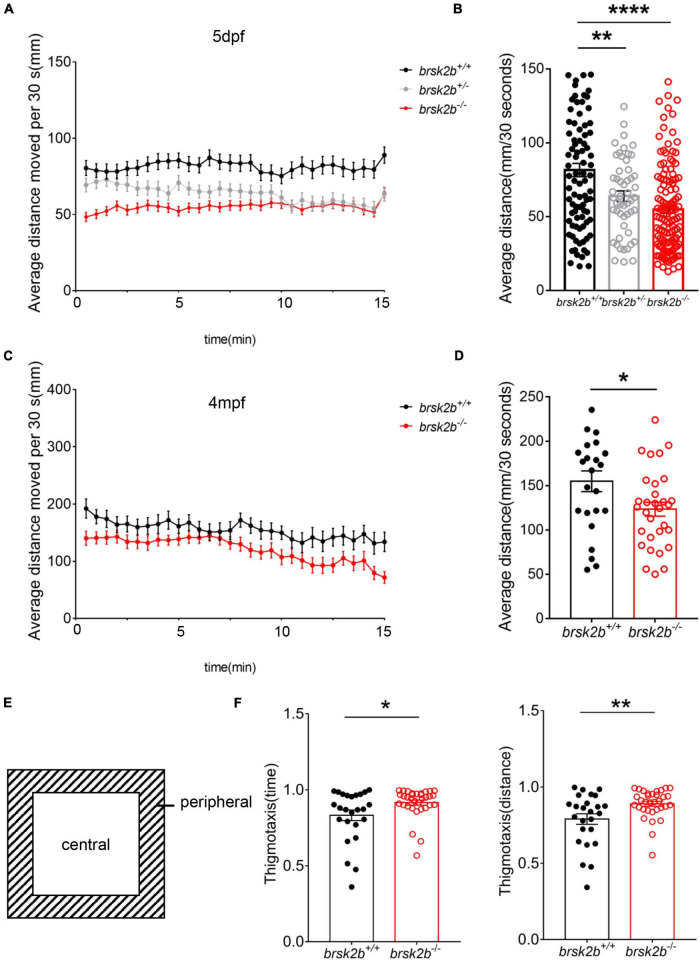
Fig. 6
Locomotor analysis of brsk2b-deficient zebrafish showed impaired activity. (A,B) The activity of brsk2b–/– larvae was significantly reduced at 5 dpf compared to brsk2b+/+ larvae (brsk2b+/+: brsk2b±: brsk2b–/– = 89: 52: 128, p = 0.0001). (C,D) The activity of brsk2b–/– Adult zebrafish at 4 mpf also decreased than that of brsk2b+/+ fish (brsk2b+/+: brsk2b–/– = 24: 31, p = 0.024). (E) The tank was divided into two equal zones, the central zone and peripheral zone. The thigmotaxis was calculated by the time and distance ratio that fish spent in the peripheral zone. (F) The brsk2b–/– zebrafish tended to stay in the periphery that both the time and distance ratio of thigmotaxis were increased significantly (brsk2b+/+: brsk2b–/– = 25: 33, p = 0.023 and 0.007, respectively). Data are shown as mean ± SEM and compared by Student’s t-test for two genotypes and one-way ANOVA for three genotypes, *p < 0.05, **p < 0.01, ****p < 0.0001.