
Image
|
Figure Caption
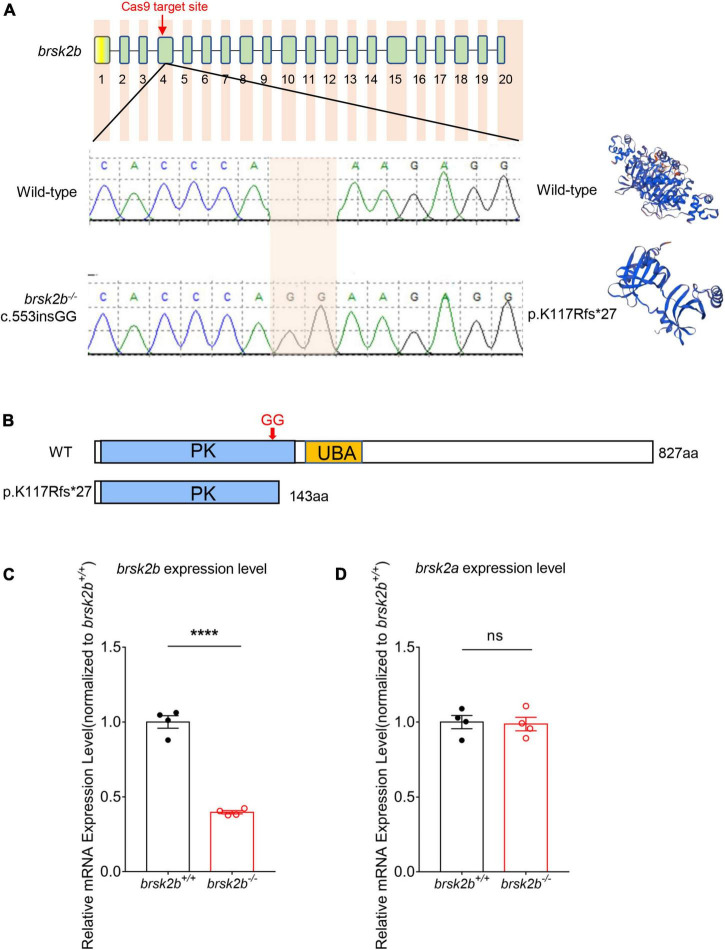
Fig. 2
Generation of brsk2b mutant zebrafish. (A) Sanger sequencing and computational modeling of wild-type and mutant brsk2b in zebrafish. (B) The protein structures of brsk2b before and after variation by CRISPR/Cas9. (C) RT-qPCR showed a decrease in brsk2b mRNA expression in brsk2b mutant zebrafish (n = 4 for each genotype, p < 0.0001). (D) RT-qPCR showed no significant difference in brsk2a mRNA expression level between wild-type and brsk2b mutant zebrafish (n = 4 for each genotype, p = 0.847). Groups were statistically compared using an unpaired Student’s t-test. Data are shown as mean ± SEM, ****p < 0.001.
Acknowledgments
This image is the copyrighted work of the attributed author or publisher, and
ZFIN has permission only to display this image to its users.
Additional permissions should be obtained from the applicable author or publisher of the image.
Full text @ Front. Mol. Neurosci.