
Image
|
Figure Caption
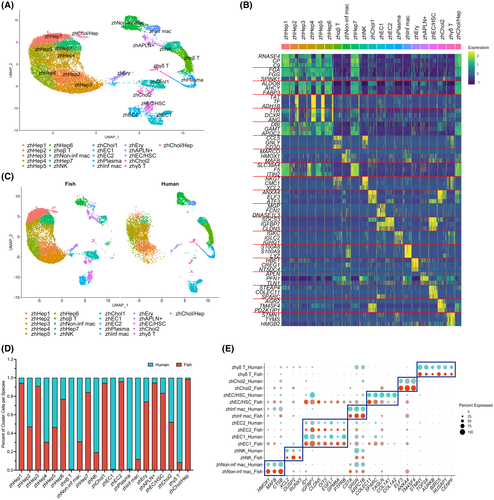
Fig. 2
Joint clustering of adult human and zebrafish liver scRNA-seq. (A) UMAP visualization of 21 clusters comprised of 8,444 adult human liver and 13,630 adult zebrafish liver cells. (B) Heatmap of gene expression for three of the top differentially expressed genes in each cluster. (C) UMAP of joint human and zebrafish clustering split by species. (D) Bar graph showing the percentage of cells contributed to each cluster from each species. (E) Dot plot showing differential expression of human cell type marker genes in select clusters split by species to show marker conservation
Acknowledgments
This image is the copyrighted work of the attributed author or publisher, and
ZFIN has permission only to display this image to its users.
Additional permissions should be obtained from the applicable author or publisher of the image.
Full text @ Hepatol Commun