
|
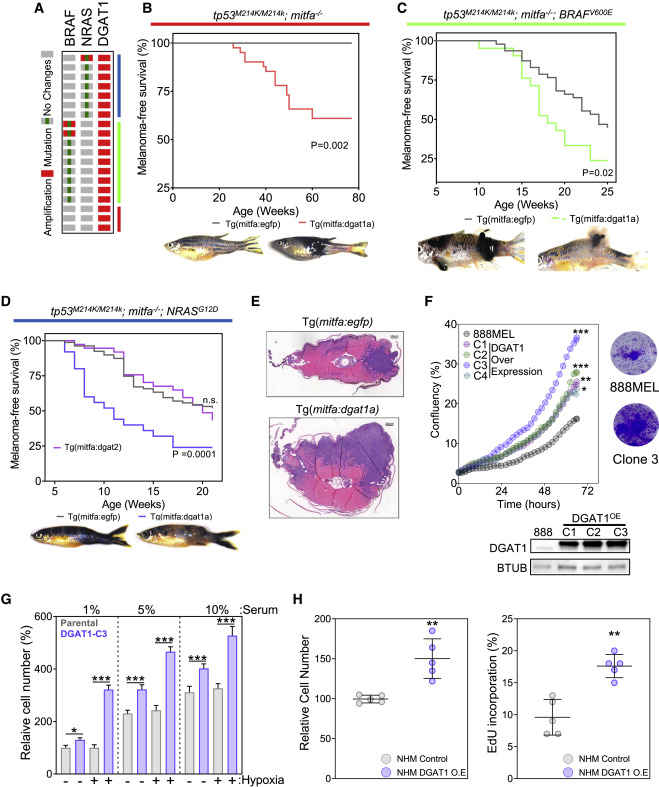
Fig. 2 Figure 2. DGAT1 functions as an oncoprotein in zebrafish and human melanocytes (A) DGAT1 amplification distribution in TCGA melanoma samples. (B) Kaplan-Meier plot of melanoma tumor nodule incidence in EGFP control or Dgat1a over-expressing animals on the tp53 mutant;nacre genetic background. Representative images shown for EGFP- and Dgat1a-positive animals at 54 and 76 weeks post-fertilization, respectively (mitfa:egfp n = 20; mitfa:dgat1a n = 20). (C) As for (B) but on the transgenic mitfa:BRAFV600E;tp53 mutant;nacre genetic background. Representative images are shown at 12 weeks post-fertilization (mitfa:egfp n = 46; mitfa:dgat1a n = 21). (D) As for (C) but on the transgenic mitfa:NRASG12D;tp53 mutant;nacre genetic background, also shown the effect of Dgat2 over-expression (mitfa:egfp n = 120; mitfa:dgat1a n = 69; mitfa:dgat2 n = 35). (E) Hematoxylin and eosin-stained transverse sections of EGFP-expressing or Dgat1a-over-expressing melanoma on the transgenic mitfa:NRASG12D;tp53 mutant;nacre genetic background. Scale bars, 200 μm (F) Confluence of parental 888MEL cells and cells following lentiviral transduction with a DGAT1 over-expression vector and clonal selection (mean, n = 3, top left). Corresponding crystal violet staining after 72-h growth (top right). Corresponding protein expression of DGAT1 (bottom). (G) Relative cell numberof parental 888MEL cells and cells following lentiviral transduction with a DGAT1 over-expression vector, determined using crystal violet staining following 48-h culture in indicated serum levels under hypoxic (1% O2) or normoxic conditions (mean ± SEM, n > 3). (H) Relative cell number of NHM and NHM following lentiviral transduction with a DGAT1 over-expression vector determined using crystal violet staining (left). Percentage of NHM and NHM following lentiviral transduction with a DGAT1 over-expression vector in S-phase by using EdU incorporation (right) (mean ± SEM, n = 5). (F–H) For significance: ∗p < 0.05, ∗∗p < 0.01, and ∗∗∗p < 0.001.