
|
Fig. 4
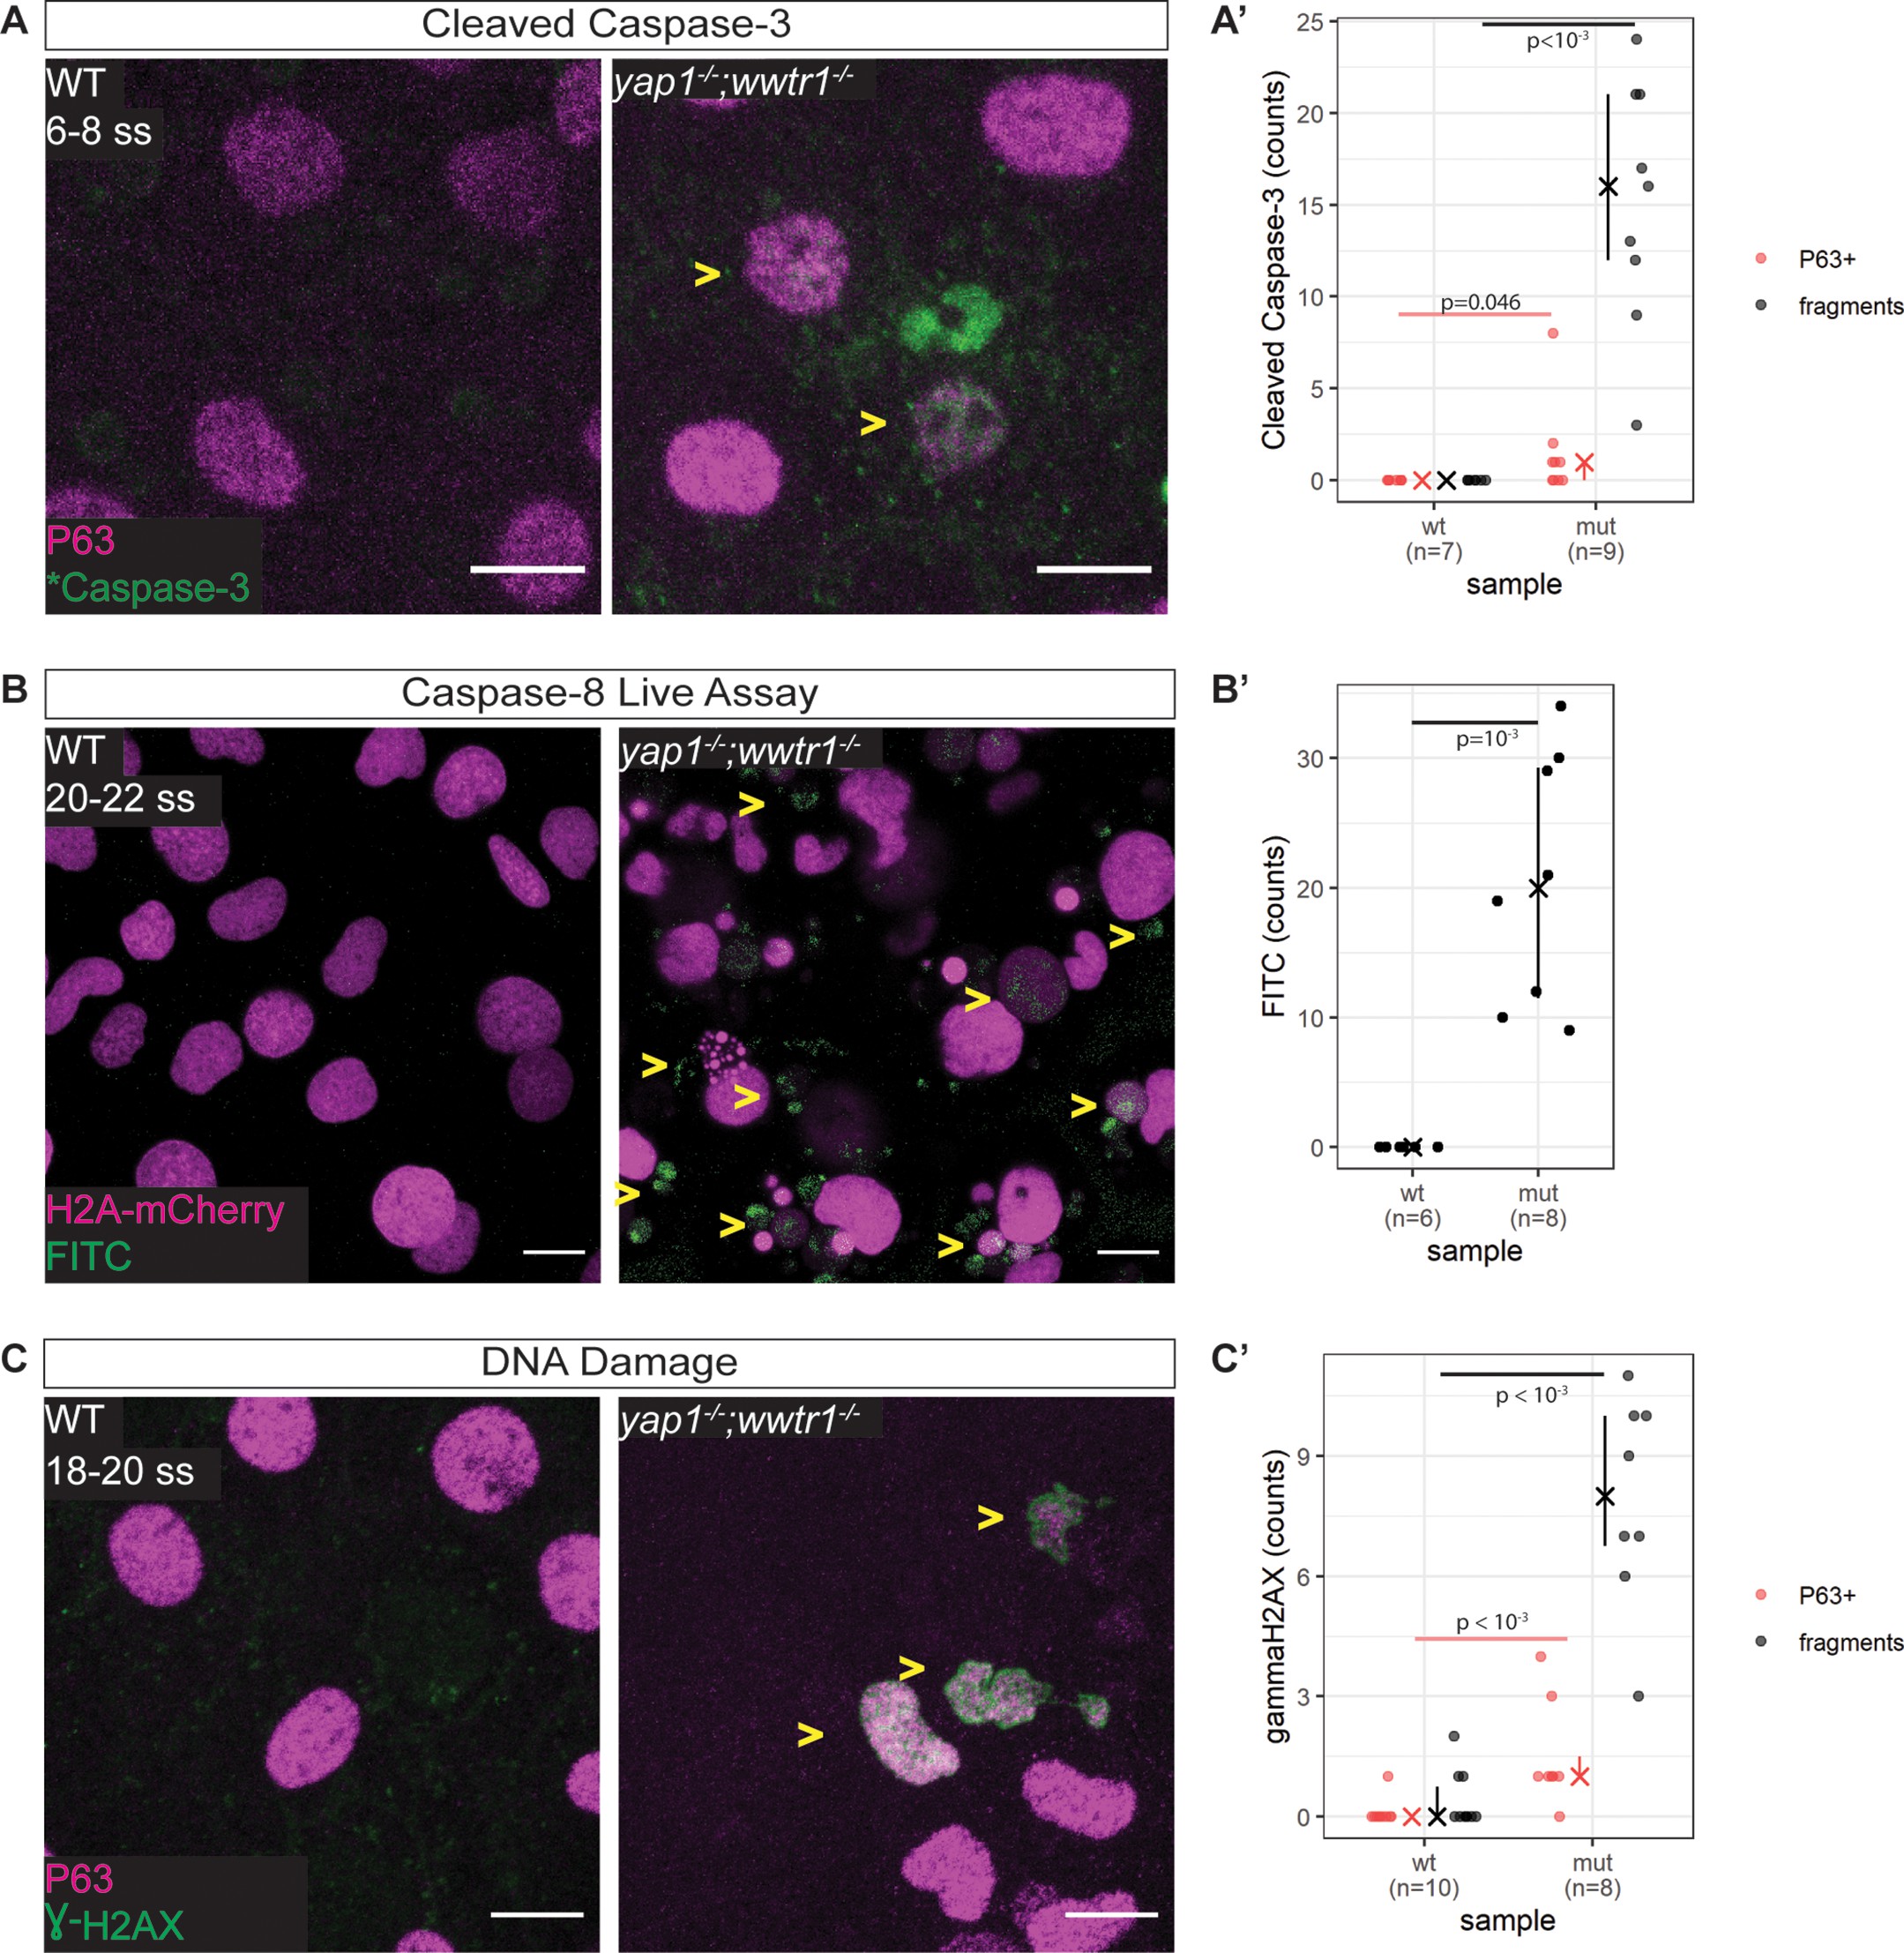
(A) Maximum intensity projections of 6–8 ss WT and mutant epidermis on the lateral yolk stained with cleaved Caspase-3 (*Caspase-3) and P63. Some *Caspase-3-positive cells are also P63-positive (yellow arrowheads). Scale bars, 10 µm. (A’) Number of epidermal basal cells (EBCs) (P63+) and apoptotic fragments (fragments) expressing cleaved Caspase-3 in WT and mutant embryo epidermis. ‘X’ represents the median, while the whiskers projecting from it represent the interquartile range. (B) Maximum intensity projections of the epidermis on the lateral yolk of 20–22 ss WT and mutant embryos expressing H2A-mCherry. Embryos were incubated in a Caspase-8 chemical probe, FITC-IETD-FMK, prior to imaging. FITC signal indicates Caspase-8 activity in cells (yellow arrowheads). Scale bars, 10 µm. (B’) Number of FITC foci in WT and mutant embryo epidermis. ‘X’ represents the median, while the whiskers projecting from it represent the interquartile range. (C) Maximum intensity projections of 18–22 ss WT and mutant epidermis on the lateral yolk stained with γH2AX and P63. Some nuclei are positive for both markers (yellow arrowheads). Scale bars, 10 µm. (C’) Number of EBCs (P63+) and apoptotic fragments (fragments) expressing γH2AX in WT and mutant embryo epidermis. ‘X’ represents the median, while the whiskers projecting from it represent the interquartile range.
Zebrafish yap1-/-;wwtr1-/- epidermal cells exhibit DNA damage and extrinsic apoptotic cell death.