
Image
|
Figure Caption
Fig. 4
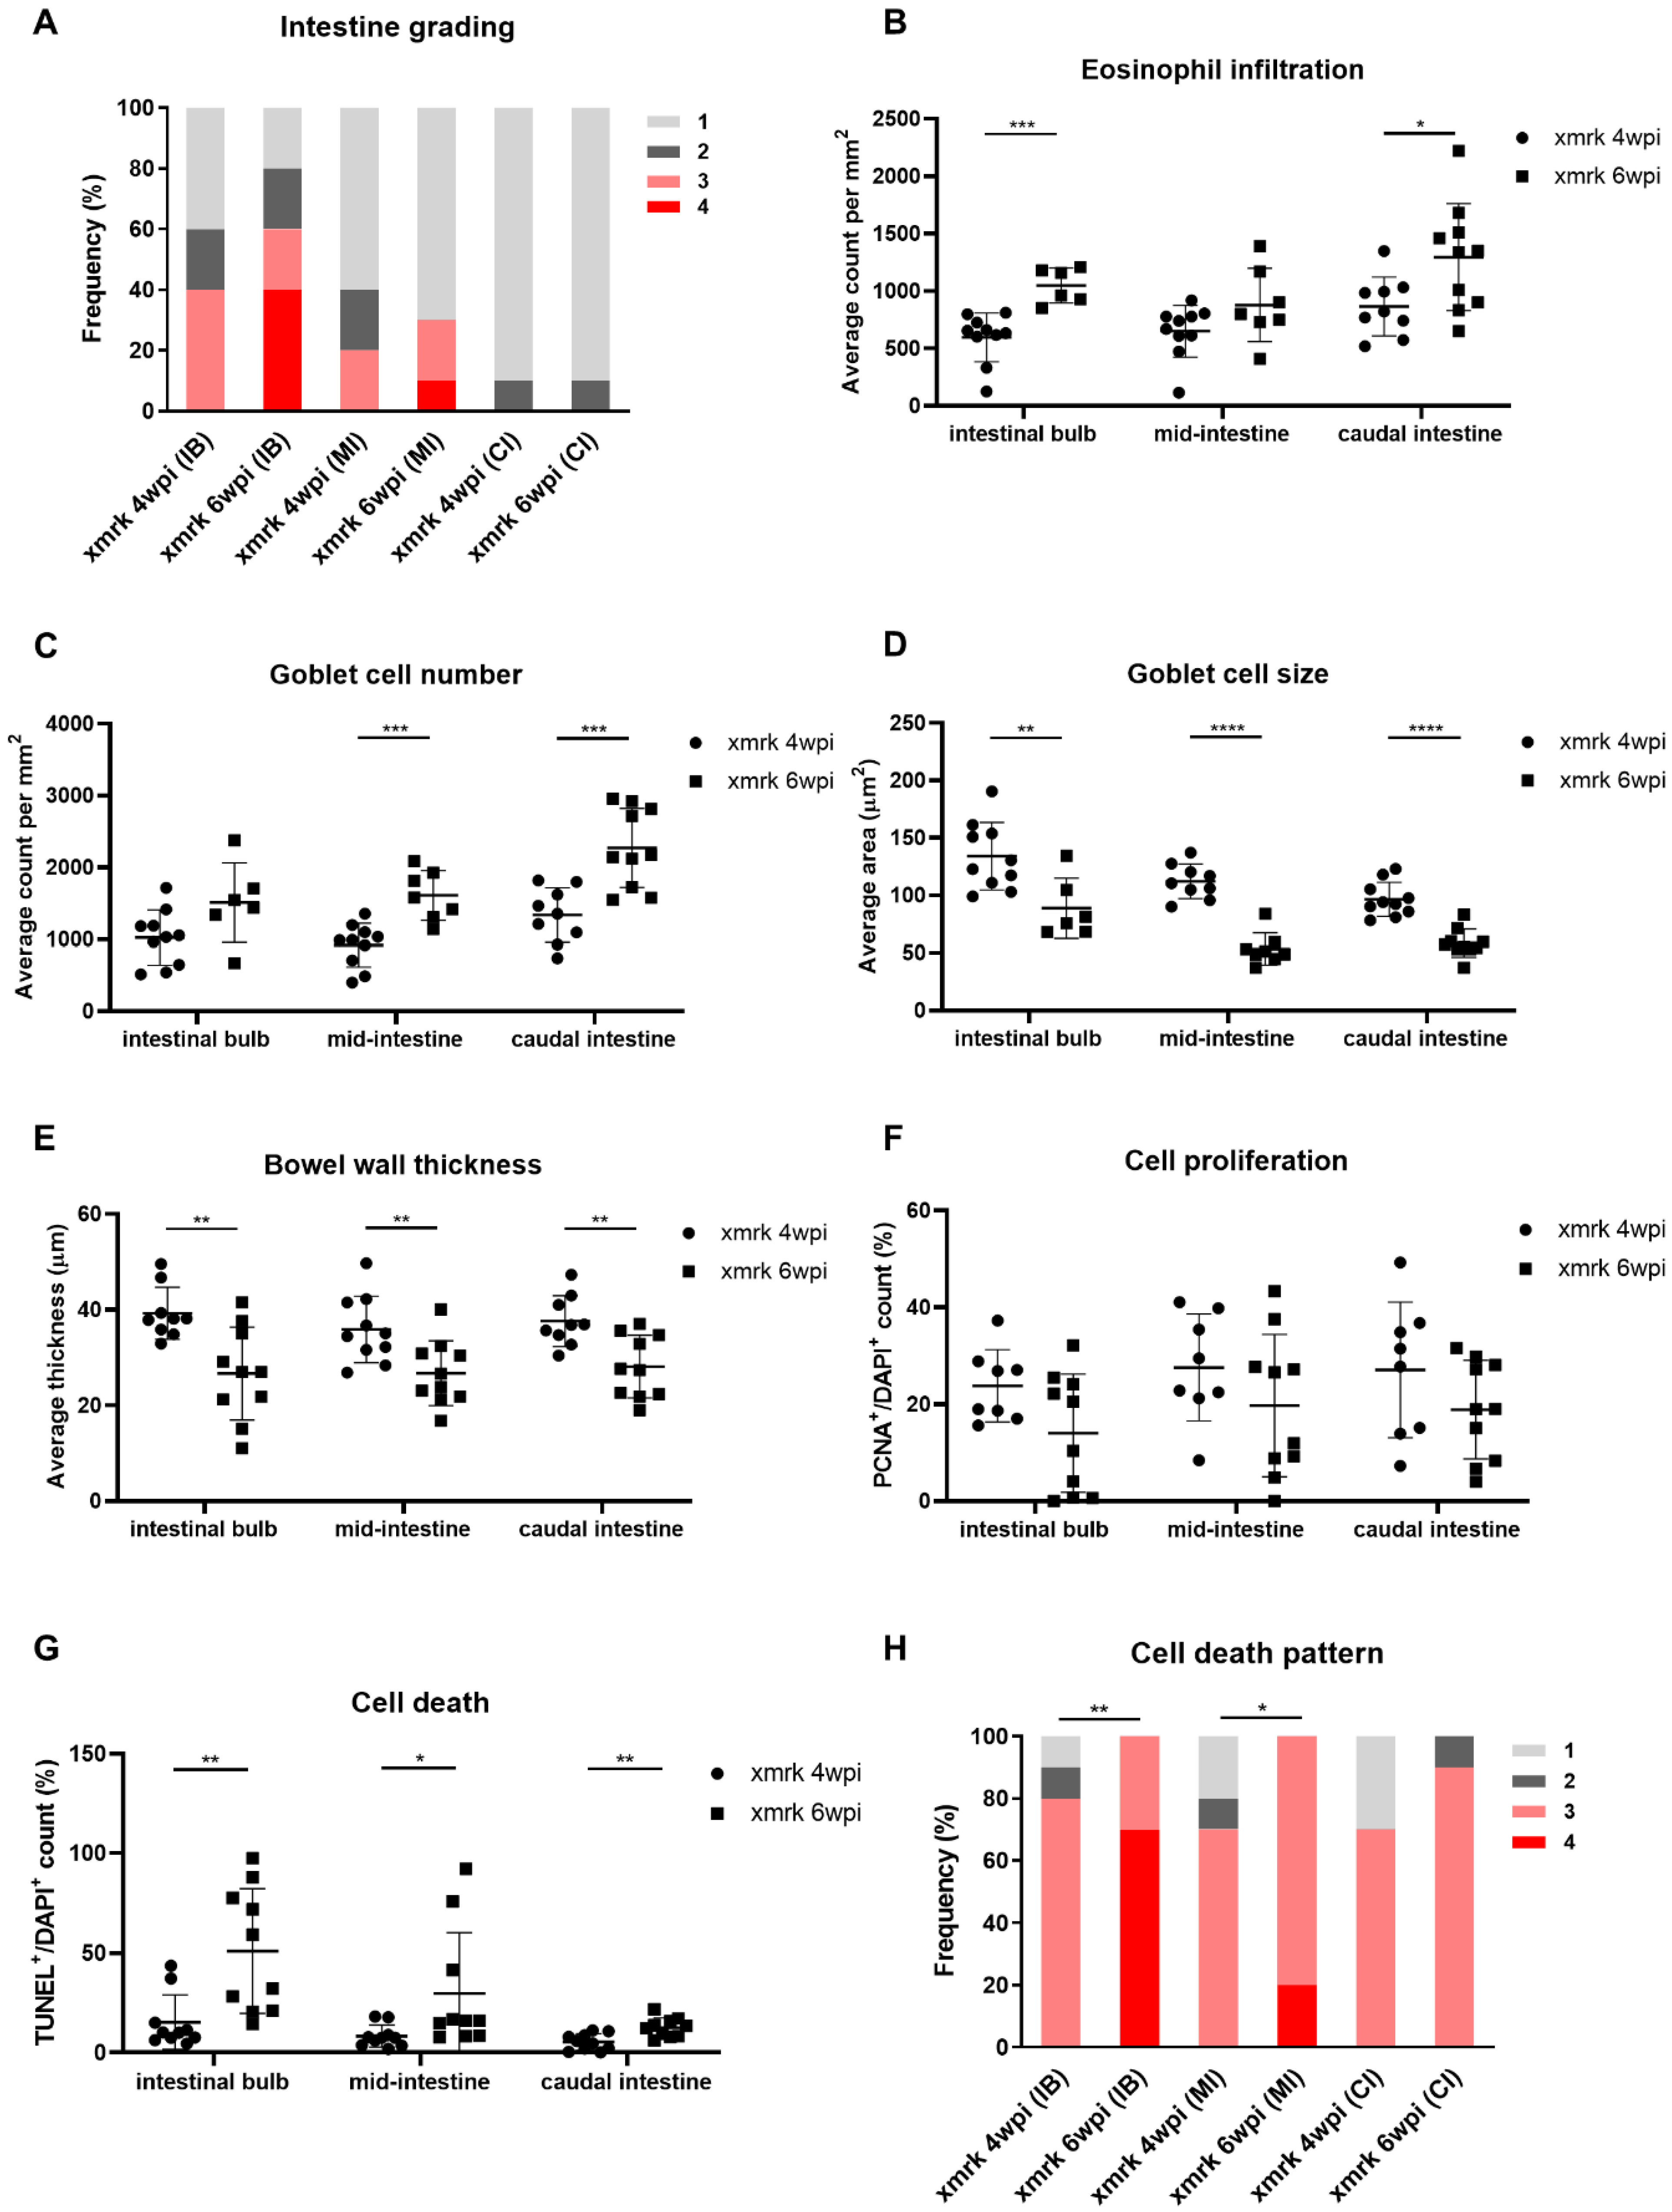
Figure 4. Progressive disruption of intestine structure upon HCC induction. (A–H) Quantification of intestinal severity grading (A), eosinophil counts (B), goblet cell counts (C), goblet cell size (D), bowel wall thickness (E), cell proliferation (F), cell death (G) and cell death pattern (H) in 4-week HCC (xmrk 4 wpi) vs. 6-week HCC (xmrk 6 wpi). wpi: weeks post-oncogene induction; IB: intestinal bulb; MI: mid-intestine; CI: caudal intestine. * p < 0.05, ** p < 0.01, *** p < 0.001, **** p < 0.0001.
Acknowledgments
This image is the copyrighted work of the attributed author or publisher, and
ZFIN has permission only to display this image to its users.
Additional permissions should be obtained from the applicable author or publisher of the image.
Full text @ Cells