
Image
|
Figure Caption
Fig. 10
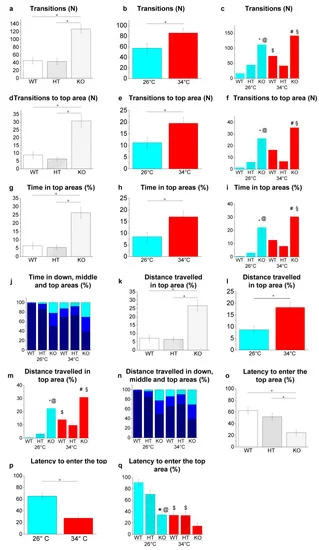
Figure 10. Novel environment exploration behaviour in the NTT. (a–c) Transitions among areas; (d–f) transitions to top area; (g–i) time spent in the top area expressed as a percentage of the total time; (j) time spent in the three vertical virtual areas of the tank expressed as a percentage of the total time; (k–m) distance travelled in the top area expressed as a percentage of the total distance travelled, (n) distance travelled in the three vertical virtual areas of the tank expressed as a percentage of the total distance travelled; (o–q) latency to enter the top area. The data are expressed as means ± S.E.M. and analysed by two-way ANOVA with Bonferroni post hoc correction. p ≤ 0.05, °; *, HT26 vs. WT26 or KO26 vs. WT26; @, KO26 vs. HT26; #, HT34 vs. WT34 or KO34 vs. WT34; §, KO34 vs. HT34; $, WT34 vs. WT26, HT34 vs. HT26 or KO34 vs. KO26. p values and symbols used in the figure are shown in Table S23. N = 20. In panels J and N, dark blue, blue and light blue colours refer respectively to bottom, middle and top areas of the tank. In all other panels, blue and red colours refer to 26 °C and 34 °C, respectively.
Acknowledgments
This image is the copyrighted work of the attributed author or publisher, and
ZFIN has permission only to display this image to its users.
Additional permissions should be obtained from the applicable author or publisher of the image.
Full text @ Int. J. Mol. Sci.