
Image
|
Figure Caption
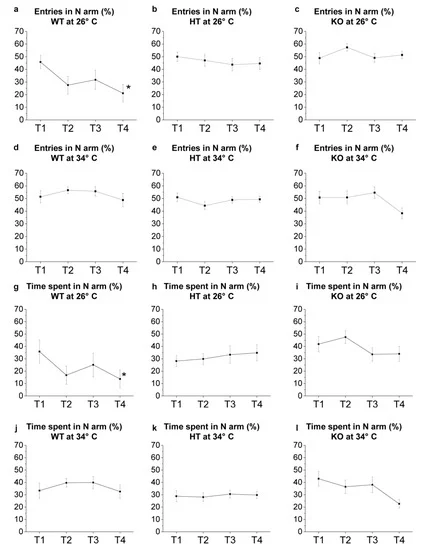
Fig. 9 Figure 9. YMT: novel environment exploration T1–T4. (a–f) Number of entries in N arm expressed as percentage of total entries in Y-maze arms; (g–l) time spent in N arm expressed as percentage of total time performed by WT (a,d,g,j), HT (b,e,h,k) and KO (c,f,i,l) at 26 °C (a–c,g–i) or 34 °C (d–f,j–l). The data were analysed by one-way repeated measures ANOVA with post hoc Bonferroni correction. p ≤ 0.05, *, compared to T1. p values are reported in Table S22. N = 14.
Acknowledgments
This image is the copyrighted work of the attributed author or publisher, and
ZFIN has permission only to display this image to its users.
Additional permissions should be obtained from the applicable author or publisher of the image.
Full text @ Int. J. Mol. Sci.