
Image
|
Figure Caption
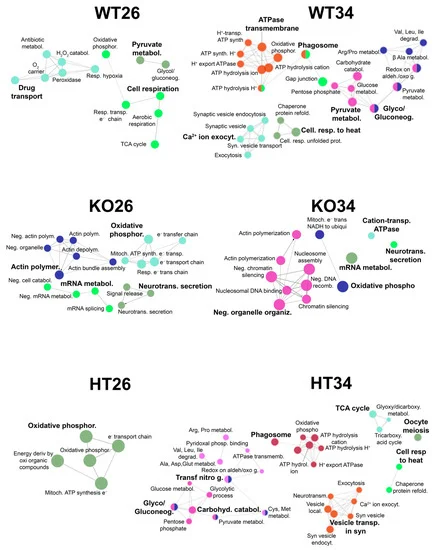
Fig. 7
Figure 7. Functional analysis by ClueGo of the proteins most differentiated comparing each data set (WT26, WT34, KO26, KO34, HT26, HT34) with all the others. All data sets were analysed using R-Bioconductor: LFQ data were normalised to the median and analysed for differential expression by the limma package, choosing |Log2FC| > 0.585 and FDR < 0.05 as differential thresholds for the limma test. Each data set was compared with all the others, and the proteins most differentiated were analysed by ClueGo. Functional grouping was based on Fischer’s exact test p ≤ 0.05.
Acknowledgments
This image is the copyrighted work of the attributed author or publisher, and
ZFIN has permission only to display this image to its users.
Additional permissions should be obtained from the applicable author or publisher of the image.
Full text @ Int. J. Mol. Sci.