
Image
|
Figure Caption
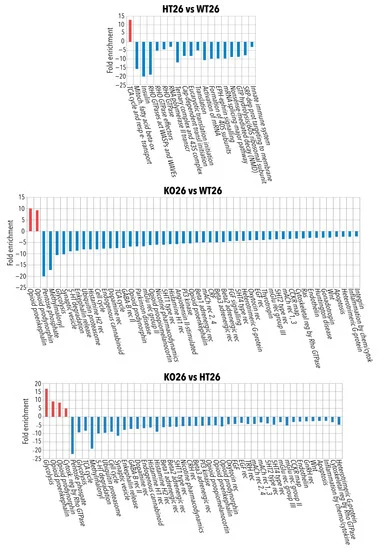
Fig. 5
Figure 5. Panther pathways analysis of the proteins differentially or exclusively expressed in HT26 vs. WT26, KO26 vs. WT26 and KO26 vs. HT26. Bioinformatic analyses were conducted by Panther software (release 16.0) to cluster enriched Panther pathway within the set of differentially expressed or exclusively expressed proteins in HT26 vs. WT26, KO26 vs. WT26 and KO26 vs. HT26. If any Panther pathways enrichment was found, the data were processed by Panther Reactome to find Reactome GO and pathways enrichment. Functional grouping was based on Fischer’s exact test p ≤ 0.05 and at least three counts.
Acknowledgments
This image is the copyrighted work of the attributed author or publisher, and
ZFIN has permission only to display this image to its users.
Additional permissions should be obtained from the applicable author or publisher of the image.
Full text @ Int. J. Mol. Sci.