
|
Figure 4
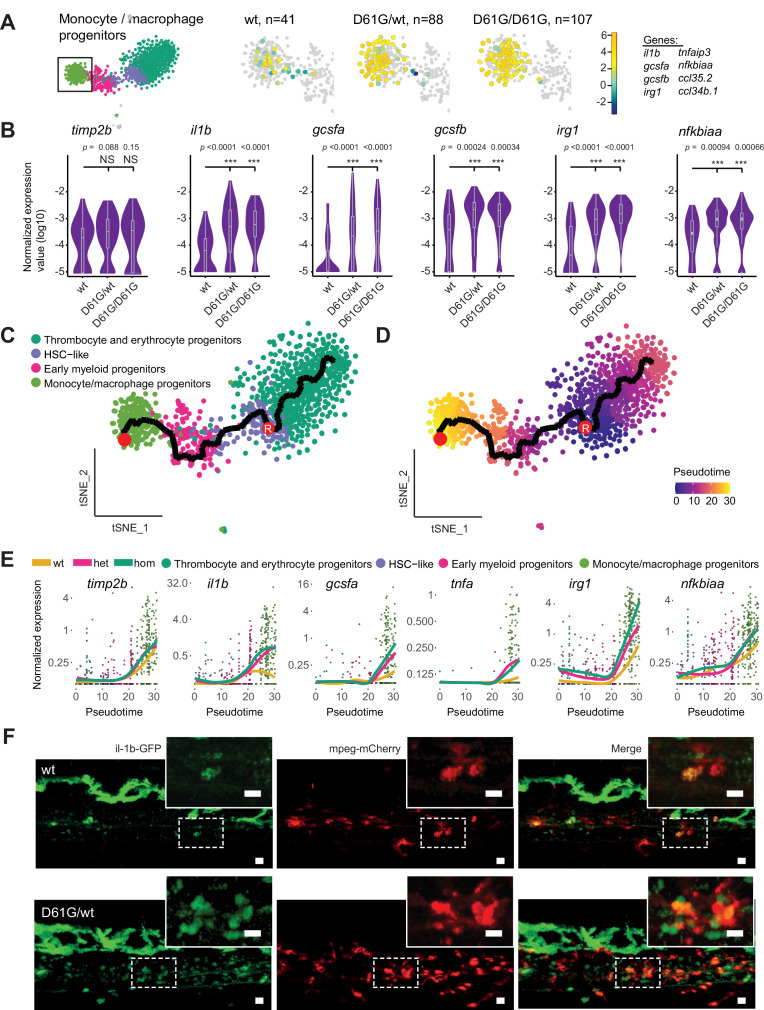
(A) The monocyte/macrophage progenitors cluster (boxed on the t-distributed stochastic neighbor embedding [t-SNE] map on left) was analyzed in detail. log2-transformed sum of read-counts of selected inflammation-related genes from the top 50 differentially expressed genes in the cells of the monocyte/macrophage progenitors cluster, with genotype and number of cells (n) indicated above. (B) Violin plots show the expression of specific genes in monocyte/macrophage progenitors of Shp2wt, Shp2D61G/wt, and Shp2D61G/D61G genotypes. NS, not significant, ***p < 0.001, t-test. (C,D) Monocle pseudotime trajectory of Shp2wt, Shp2D61G/wt, and Shp2D61G/D61G hematopoietic stem and progenitor cells (HSPCs) differentiation superimposed on the four clusters and indicated by color in D. A route leading from hematopoietic stem cell (HSC)-like cells to monocyte/macrophage progenitors was selected and its root (R) and end are marked with red circles. (E) Pseudotemporal expression dynamics of specific genes along the selected route. The lines represent the smoothened regression of the moving average for Shp2wt, Shp2D61G/wt, and Shp2D61G/D61G genotypes. (F) In vivo imaging of the caudal hematopoietic tissue (CHT) region of Shp2wt and Shp2D61G/wt zebrafish embryos in Tg(il1b:eGFP, mpeg:mCherry) background at 5 days post fertilization (dpf). Representative images are shown. The dashed line boxed region of CHT is zoom-in in inset. Scale bar, 10 μm.
Inflammatory response in monocyte/macrophage progenitors in Shp2D61G embryos.