IMAGE

Fig. 1.

ID
ZDB-IMAGE-220521-2
Source
Figures for Espinosa et al., 2022
Image
Figure Caption

Fig. 1.

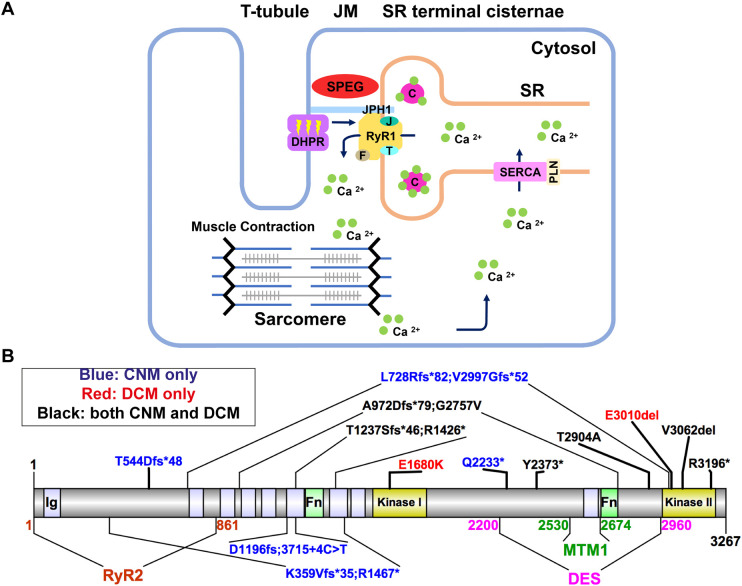
Schematic diagrams of excitation–contraction coupling (ECC) at the triad, and SPEG domains and pathogenic variants. (A) The triads are made of transverse tubules (T-tubules) flanked by terminal cisternae of the sarcoplasmic reticulum (SR). Junctional membranes (JM) are connected by the interaction of the ryanodine receptor (RyR1) at the SR, and dihydropyridine receptor (DHPR) at the T-tubules, forming the core components of the ECC machinery. ECC starts when a neuronal action potential arrives via T-tubules and causes a conformational change in DHPR, allowing it to interact with RyR1, leading to its activation. As a result, calcium (Ca2+) leaves the SR via RyR1 channel opening and moves into the cytosol, promoting sarcomeric contraction. Finally, RyR1 is closed and the Ca2+ transporter sarco/endoplasmic reticulum Ca2+-ATPase [SERCA; also known as ATP2A; regulated by phospholamban (PLN)] returns Ca2+ into the SR, where it is largely bound to calsequestrin (C). The terminal SR also contains RyR1 modulators, such as junctophilin-1 (JPH1), FK506-binding protein 1A (F), junctin (J) and triadin (T). Striated muscle enriched protein kinase (SPEG) is localized at the triad, but its role remains elusive. (B) SPEG contains immunoglobulin domains (Ig; light purple shaded), fibronectin domains (Fn; light green shaded) and two kinase domains (yellow shaded). SPEG directly binds to myotubularin 1 (MTM1; dark green; SPEG 2530-2674 a.a.) (Agrawal et al., 2014) and desmin (DES; magenta; SPEG 2200-2960 a.a.) (Luo et al., 2020) at the inter-kinase domain. Pathogenic variants in SPEG span different regions of the gene and are typically nonsense mutations that result in decreased SPEG levels. The variants exist either in compound heterozygosity (e.g. K359Vfs*35; R1467*), or homozygosity (e.g. T544Dfs*48). SPEG mutations can cause a skeletal muscle disorder only (i.e. centronuclear myopathy or CNM, blue font), a cardiomyopathy only (e.g. dilated cardiomyopathy, red font) or both (black font), with no clear genotype–phenotype correlation. Note that patient Q2233* died before a cardiac evaluation. Illustrations were made using Illustrator for Biological Sciences (IBS) (Liu et al., 2015).

Acknowledgments
This image is the copyrighted work of the attributed author or publisher, and ZFIN has permission only to display this image to its users. Additional permissions should be obtained from the applicable author or publisher of the image. Full text @ Dis. Model. Mech.