IMAGE

FIGURE 4

ID
ZDB-IMAGE-220515-38
Source
Figures for Winter et al., 2022
Image
Figure Caption

FIGURE 4

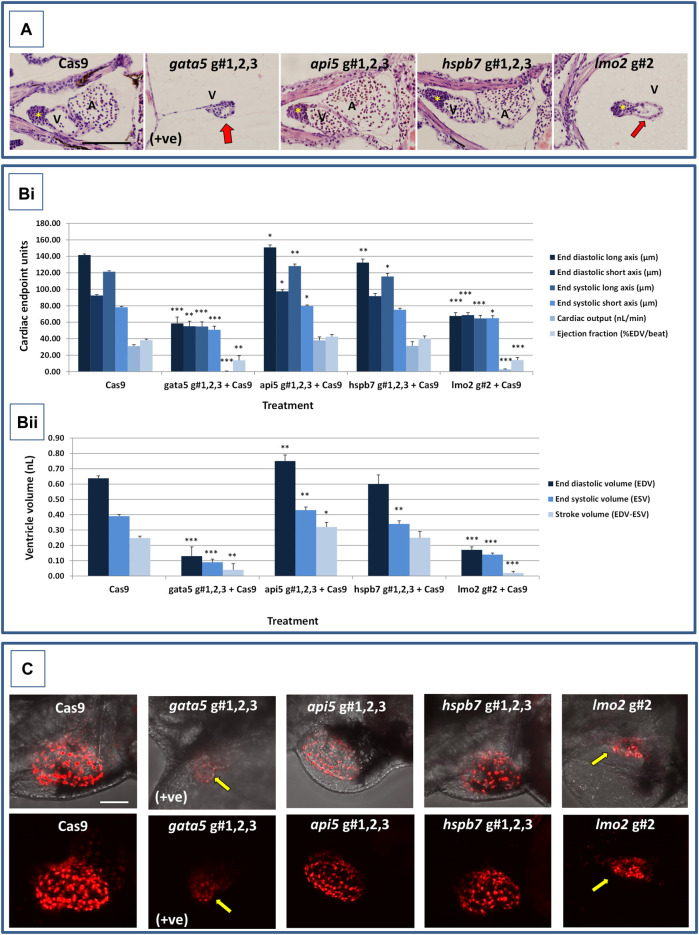
Results of the cardiac pathological analysis of 4 dpf gata5 (positive control), api5, hspb7 and lmo2 zebrafish crispants vs. the Cas9-injected control animals. Panel (A) Example haematoxylin and eosin stained coronal sections through the heart (top, A = atrium, V = ventricle, *bulbous arteriosus) from each of the treatment groups vs. the Cas9-injected controls (left-hand panels). Note in particular the extreme cardiac hypoplasia after gata5 and lmo2 mutation (indicated by a red arrow in the images) in which the atrium is not visible probably due to the severe pericardial oedema and resultant distension of the heart muscle. In each panel, animals are orientated with the head to the left, and viewed in the dorsal plane at a magnification of ×40 (the scale bar shown in left-hand image represents 200 μm). Panel B) Results of the analysis of ventricular dimensional analysis of the crispant vs. Cas9 control animals. Shown are the ventricle dimensions and cardiac functional parameters, calculated from the measurement of ventricle dimensions in 5 randomly selected embryos from each of the two runs undertaken on each gene. Panel (Bi) shows a graph of the ventricle diameter, cardiac output and ejection fraction data, and Panel (Bii) a graph of the ventricle volume-related measurements. In all cases data are shown as the mean and ±SEM of the animals in each group (n = 10 per group except n = 9 for the gata5 cardiac output data due to the absence of a heart beat in one animal). For brevity the Cas9 data are shown as the mean across all 4 Cas9 datasets (n = 40 animals), however, statistical analysis was undertaken on the crispants versus the corresponding Cas9 control data in each case. *signifies a statistically significant difference vs. the Cas9 control for that parameter at p < 0.05, ** at p < 0.01, and *** at p < 0.001 (Student’s t-test or Mann Whitney U-tests). Note: the overall body lengths of the gata5 and the lmo2 crispants were also significantly reduced (p < 0.001). Panel (C) Example images of hearts from cmlc2:DsRed2-nuc larvae in which the cardiomyocytes are labelled red, especially prominently in the ventricle. The top row of panels shows the image with transmitted light and cmlc2::DsRed2-nuc fluorescence signals, and the lower row shows the same example but with the cmlc2::DsRed2-nuc signal alone. Note the severe oedema, weaker cmlc2::DsRed2-nuc fluorescence signal, reduced number of cells and smaller chamber size typical of the gata5 crispant (indicated by the yellow arrow in images); the oedema, and slightly enlarged ventricle observed in the api5 crispant; and the severe oedema, disorganisation of myocytes and smaller chamber size typical of the lmo2 crispants (yellow arrow). hspb7 crispant larval hearts outwardly appeared no different to the Cas9 controls. The scale bar shown in the upper left-hand image represents 50 μm.

Figure Data
Acknowledgments
This image is the copyrighted work of the attributed author or publisher, and ZFIN has permission only to display this image to its users. Additional permissions should be obtained from the applicable author or publisher of the image. Full text @ Front Pharmacol