
|
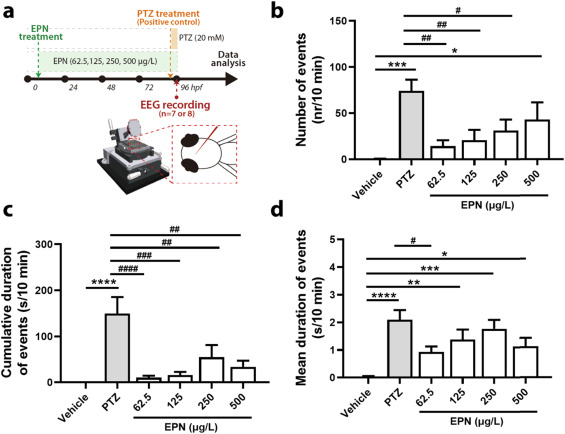
Fig. 7 EEG recording results for EPN treatment in zebrafish embryos. (a) EEG recording method. EPN was treated at 6 hpf in zebrafish larvae (n = 7 or 8) until 96 hpf. PTZ was treated to zebrafish larvae for 15 min before 96 hpf; (b) Number of events; (c) Cumulative duration of events; (d) Mean duration of events. Results were expressed as mean ± SEM. Significant differences in the comparison to control expressed by the symbols *,**,***, and **** for expressing p < 0.05, p < 0.01, p < 0.001, and p < 0.0001, respectively. Significant differences in the comparison to PTZ-treated group (positive control) expressed by the symbols #,##,###, and #### for expressing p < 0.05, p < 0.01, p < 0.001, and p < 0.0001, respectively.