
Image
|
Figure Caption
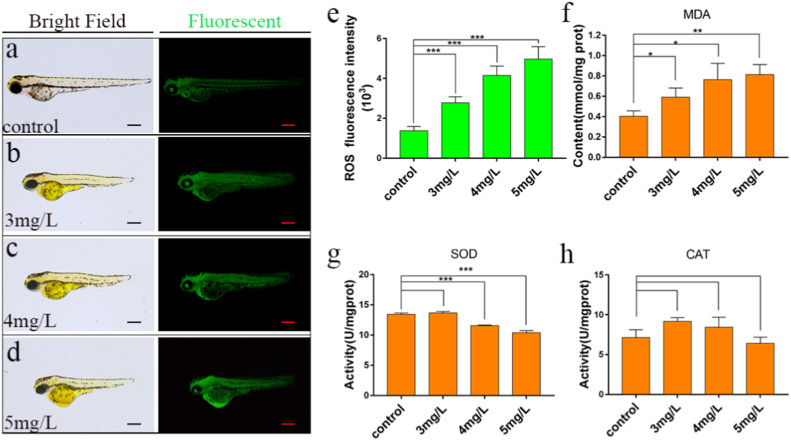
Fig. 4 PND induced oxidative stress in zebrafish larvae. (a-d) different concentrations of PND showed the distribution of reactive oxygen species in zebrafish larvae. (e) The relative fluorescence intensity of ROS. (f) The relative content of MDA. (g-h) The activities of SOD and CAT were determined. The values are expressed as the mean ± standard deviation of three independent experiments (n = 3). *p < 0.05, **p < 0.01, ***p < 0.001; Scale = 350 µm.
Figure Data
Acknowledgments
This image is the copyrighted work of the attributed author or publisher, and
ZFIN has permission only to display this image to its users.
Additional permissions should be obtained from the applicable author or publisher of the image.
Full text @ Ecotoxicol. Environ. Saf.