
|
Figure 2
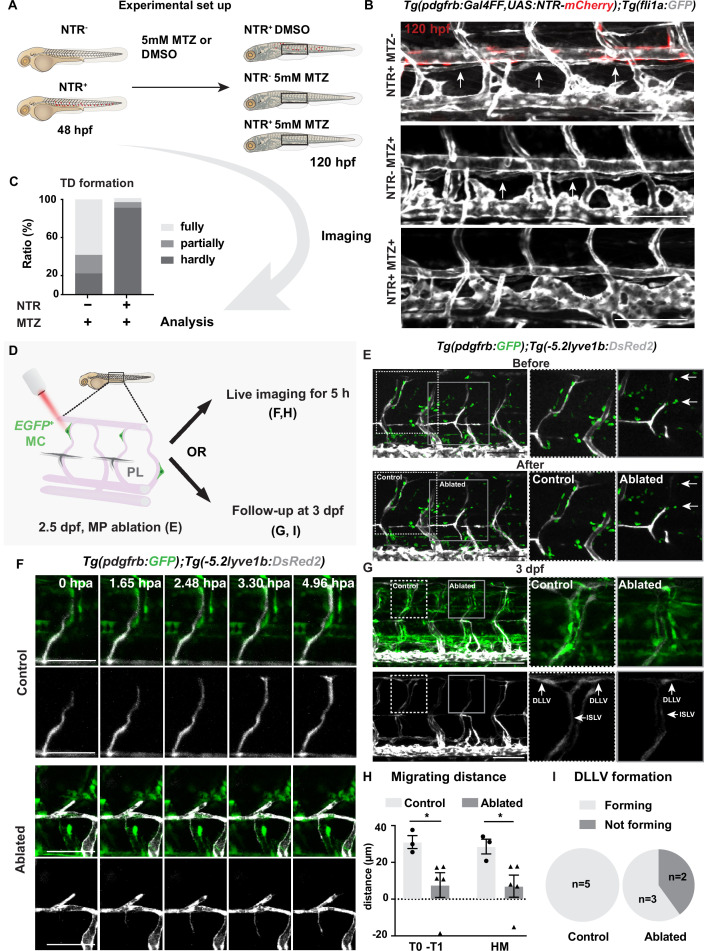
(A) Work flow of cell ablation by the nitroreductases (NTR)-metorodinazole (MTZ) system. Tg(pdgfrb:Gal4FF);Tg(14xUAS:3xFLAG-NTR,NLS-mCherry) (red) and Tg(fli1a:GFP) (grey) were imaged at 120 hours post fertilization (hpf) after treatment with DMSO or 5 mM MTZ from 48 hpf, and the formation of thoracic duct (TD) was analysed. (B) Confocal stack images of the trunk in 5 days post fertilization (dpf) embryos treated as described in (A). Arrows indicates TD forming beneath dorsal aorta. Asterisks indicate the absence of TD. Scale bar: 100 μm. (C) Quantification of (B). Embryos were scored as fully (completely connected TD), partially (partially formed TD) and hardly (almost or no TD visible) formed based on the TD development. In the NTR- MTZ+ group (n = 36), n = 21 embryos with fully formed TD, n = 7 embryos with partly formed TD, n = 8 embryos with hardly formed TD were identified. In the NTR+ MTZ+ group (n = 34), n = 1 embryo with fully formed TD, n = 2 embryos with partly formed TD, n = 31 embryos with hardly formed TD were identified. Data were presented as ratio to total number of embryos analysed. (D) Work flow of cell ablation by multi-photon microscopy. Mural cells (MCs, green) labelled by TgBAC(pdgfrb:GAL4FF; UAS:GFP) and lymphatic endothelial cells (LECs) by Tg(–5.2lyve1b:DsRed2) (grey). MCs on intersegmental vessel in proximity to sprouting LEC were ablated at 57 hpf. For analysis, ablation was either followed by time-lapse imaging or confocal imaging at 3 dpf. (E) Confocal stack images before and after ablation. Control ablation (dashed box) in the adjacent region of GFP+ MCs and GFP+ MC on arterial intersegmental vessel (aISV) (solid grey box) was performed in the same embryos. Arrows indicate ablated GFP-positive cells. Scale bar: 100 μm. Middle and right panels, zoom-in images cropped in z-stacks. (F) Live imaging of lymphatic endothelial cell migration in the context of control (top images) and GFP+ MC on aISV (bottom images) after ablation, with confocal stack images from time lapse at selected timepoints from 0 to 4.96 hpa. Scale bar: 50 μm. (G) Confocal stack images of 3 dpf embryos in (E). Dashed box, control ablation. Solid grey box, MC ablation. DLLV, dorsal longitudinal lymphatic vessel; ISLV, intersegmental lymphatic vessel. Scale bar: 100 μm. (H) Quantification of migration distance from time-lapse videos corresponding to (F). Distance was calculated as both T0-T1 and the perpendicular distance between the T1 and HM for embryos with (n = 4) or without (control, n = 3) ablation. T0, the sprouting front of LECs at the start of video; T1, sprouting front of LECs at the end of video. Data are presented as mean ± SEM, unpaired two-tailed Student’s t-test or Mann-Whitney test was used on two types of measurements respectively. *p < 0.05. (I) Quantification of DLLV formation at 3 dpf. DLLV forming (n = 3), not forming (n = 2) in the ablated group and DLLV forming (n = 5) in the control group.
Mural cells are required for formation of lymphatic vascular bed.