IMAGE

FIGURE 3

ID
ZDB-IMAGE-220430-30
Source
Figures for Wu et al., 2022
Image
Figure Caption

FIGURE 3

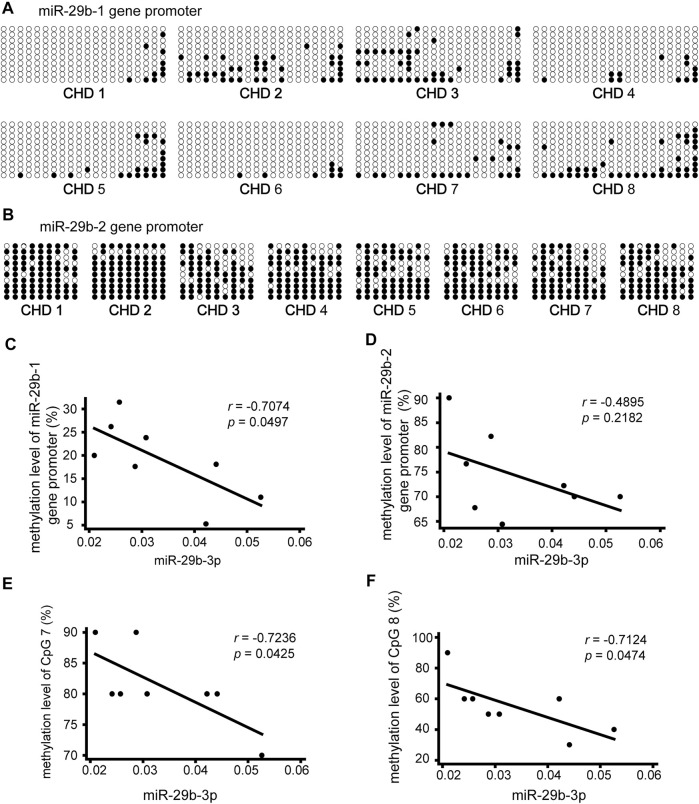
Association of miR-29b-3p expression with its methylation status in eight patients with CHD. (A and B) Methylation status of the promoter region of the miR-29b-1 gene and miR-29b-2 gene. The black and white circles represent methylated and unmethylated CpG dinucleotides, respectively. (C) Correlations between miR-29b-3p expression and the methylation status of the miR-29b-1 gene (r = −0.7074, p = 0.0497, and N = 8). (D) Correlations between miR-29b-3p expression and the methylation status of the miR-29b-2 gene (r = −0.4895, p = 0.2182, and N = 8). (E) Correlations between miR-29b-3p expression and the methylation status of CpG 7 located in the miR-29b-2 gene (r = −0.7236, p = 0.0425, and N = 8). (F) Correlations between miR-29b-3p expression and the methylation status of CpG 8 located in the miR-29b-2 gene (r = −0.7124, p = 0.0474, and N = 8). Spearman’s correlation tests were used.

Acknowledgments
This image is the copyrighted work of the attributed author or publisher, and ZFIN has permission only to display this image to its users. Additional permissions should be obtained from the applicable author or publisher of the image. Full text @ Front Cell Dev Biol