
Image
|
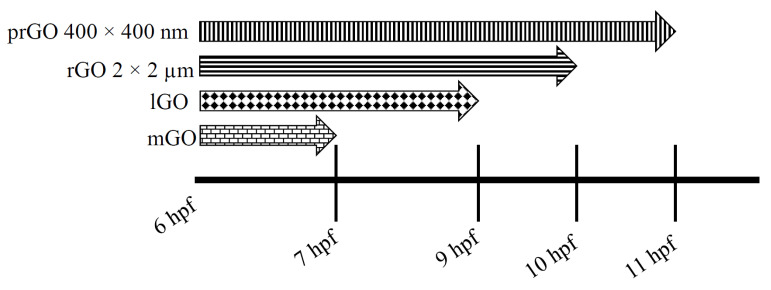
Figure Caption
Figure 5 Figure 5. Window of susceptibility starting at 6 hpf. All GOs were tested at 50 μg/mL. mGO (brick pattern) caused the most rapid mortality with significant mortality observed at 7 hpf (p = 0.037). lGO (diamond pattern), rGO 2 μm × 2 μm (horizontal stripes), and prGO 400 nm × 400 nm (vertical stripes) caused significant mortality 9 hpf (p = 0.027), 10 hpf (p = 0.012), and 11 hpf (p = 0.012) (respectively). Significant mortality at specified timepoints was determined by Welch’s t-tests (α = 0.05).
Acknowledgments
This image is the copyrighted work of the attributed author or publisher, and
ZFIN has permission only to display this image to its users.
Additional permissions should be obtained from the applicable author or publisher of the image.
Full text @ Nanomaterials (Basel)