
Image
|
Figure Caption
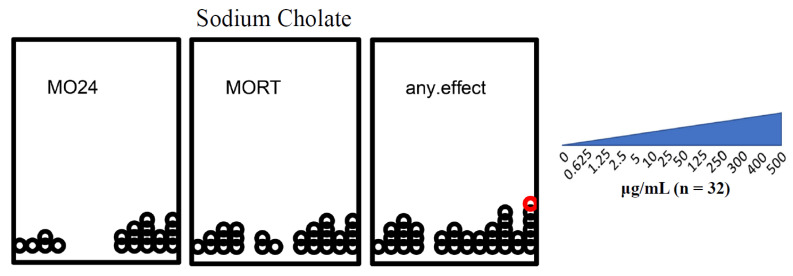
Figure 1 Figure 1. Developmental toxicity of sodium cholate. MO24 = 24 hpf mortality; MORT = 120 hpf mortality; any.effect = physical malformations, including mortality at 120 hpf. Outcomes significantly above the binomial threshold (Student’s t-test; α = 0.05) are indicated in red on the dot plot. The sodium cholate concentration gradient increases from left to right (0 μg/mL, 0.625 μg/mL, 1.25 μg/mL, 2.5 μg/mL, 5 μg/mL, 10 μg/mL, 25 μg/mL, 50 μg/mL, 125 μg/mL, 250 μg/mL, 300 μg/mL, 400 μg/mL, 500 μg/mL).
Acknowledgments
This image is the copyrighted work of the attributed author or publisher, and
ZFIN has permission only to display this image to its users.
Additional permissions should be obtained from the applicable author or publisher of the image.
Full text @ Nanomaterials (Basel)