IMAGE

Fig. 6

ID
ZDB-IMAGE-220415-29
Source
Figures for Banono et al., 2020
Image
Figure Caption

Fig. 6

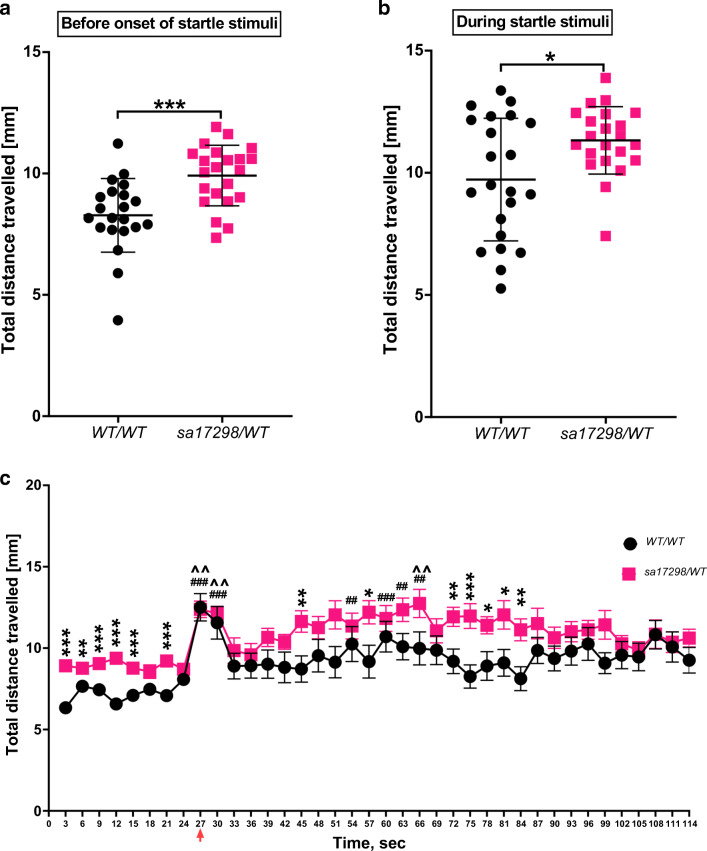
Startle response to dark flashes. a Baseline locomotor activity 21 s prior to onset of startle stimuli, ***p < 0.001. Data represented as mean ± SD. b Mean distance moved in response to startle stimuli. Unpaired Student’s t test showed cacna1daWT/WT moved less than cacna1dasa17298/WT during the 90-s startle stimulation, *p < 0.05. Data represented as mean ± SD. c Distance moved in response to startle stimuli represented as mean ± SEM. Paired Student’s t test analysis between cacna1daWT/WT and cacna1dasa17298/WT with statistical significance represented as *p < 0.05, #p < 0.01, ^p < 0.001. Red arrow: onset of startle stimulus (dark flashes)

Figure Data
Acknowledgments
This image is the copyrighted work of the attributed author or publisher, and ZFIN has permission only to display this image to its users. Additional permissions should be obtained from the applicable author or publisher of the image. Full text @ Mol. Neurobiol.