
|
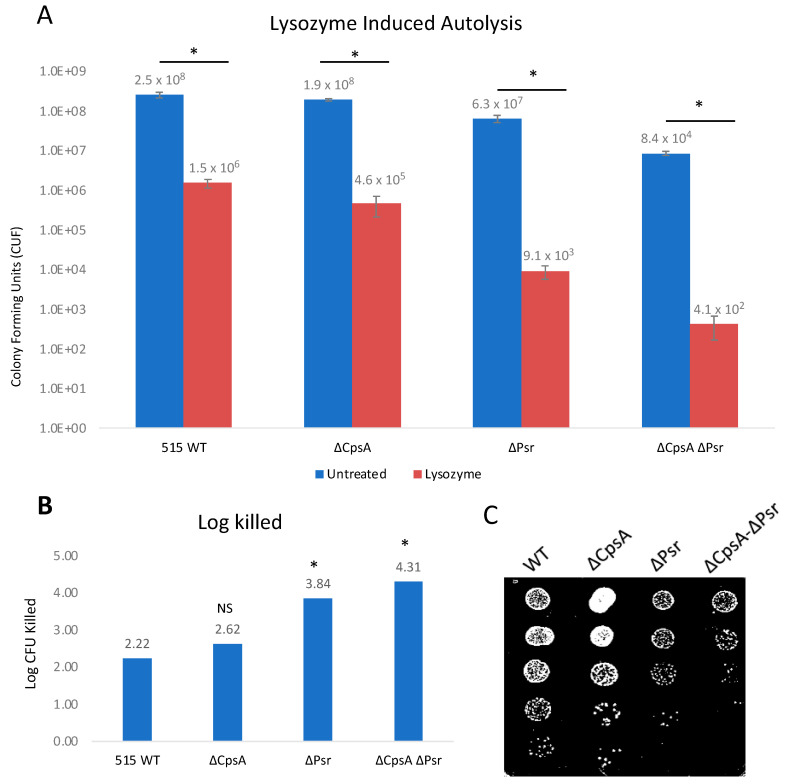
Figure 6
GBS autolysis increases in the presence of lysozyme. GBS strains were grown to mid-log in THYB, normalized to OD600: 0.3 in PBS and treated with 1 mg/mL lysozyme for 24 h. (A) Treated (Red) and untreated (Blue) samples were then serially diluted and plated on THY plates and counted. Statistical analysis represents significance between untreated and treated cells for each strain. (B) Log CFU killed was calculated for each sample taking Log10 (untreated/treated). Significance was determined by comparing log CFU killed of each strain to that of wild type GBS. (C) 5 μL of serial dilutions of treated cells was dotted on THY plates and grown overnight for visual representation of treatment outcomes. Values represented are averages of four biological replicates. * p < 0.05.