
|
FIGURE 6
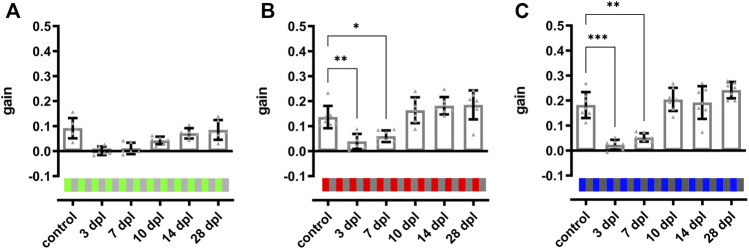
Color vision is restored at 10 days after light lesion. Quantifications of the gain obtained after light lesion for red (B) and blue (C) colored stimuli on an intensity-matched grey background (100%/0.2 cpd/15 dps) revealed a significant reduction at 3 and 7 dpl but restoration to baseline levels at 10 dpl. The quantification of the gain for a green stimulus (A) showed a similar trend but was not significantly different. Individual data are summarized in Table 2. Statistics: all data are represented as mean ± SD, one-way ANOVA with Dunnett’s multiple comparison test against control, p < 0.05 (*); 0.01 (**); 0.001 (***) or 0.0001 (****).