
|
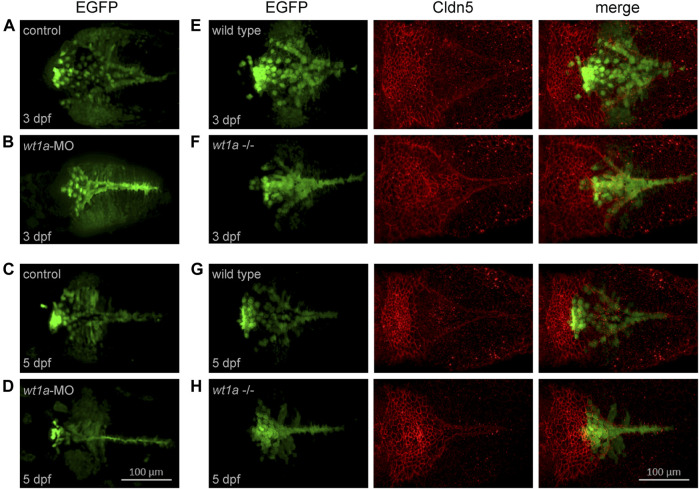
FIGURE 4
Wt1a morphants and mutants show anomalies in choroid plexus development. For the analysis of morphants the Tg(wt1a:EGFP) line and for mutants the Tg(wt1a:EGFP); wt1a ex1_del5 line has been used. (A–D) Wt1+ positive cells, visualized by EGFP fluorescence, in zebrafish larvae injected with control morpholino (A,C) or wt1a morpholino (B,D) at three dpf (A,C) and five dpf (B,D). (E–H) Wt1+ positive cells (left), visualized by EGFP fluorescence in wildtype (E,G) or homozygous wt1a mutant larvae (F,H) of the Tg(wt1a:EGFP) line were stained with a-Cldn5 antibody (middle) at three dpf (E,F) and five dpf (G,H). All panels represent 3D reconstructions of image stacks (dorsal views with rostral to the left).