
|
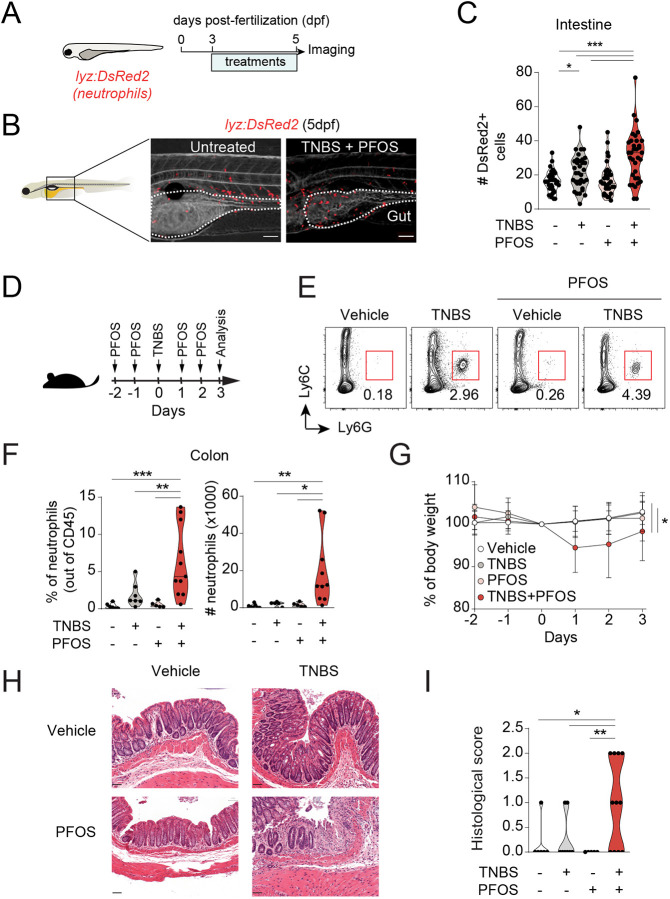
Fig. 3.
PFOS increases neutrophil recruitment to the intestine during TNBS-induced intestinal inflammation in zebrafish larvae and mice. (A) Experimental outline. Tg(lyz:DsRed2) zebrafish larvae were exposed to TNBS (50 µg/ml) and PFOS (200 nM) from 72 hpf until 120 hpf. (B) High-resolution light-sheet microscopy images of TNBS+PFOS and untreated lysC:DsRed2 larvae at 5× magnification at 120 hpf. The intestine is marked in yellow and outlined in white. Red fluorescence marks neutrophils. Scale bars: 100 µm. (C) Quantification of DsRed2+ cells in the intestine. n=32-35, five experiments. Each data point represents one 120 hpf zebrafish larva. The black line represents the median. (D) Experimental outline. Mice received a single dose of TNBS (1%, in 50% ethanol, intrarectally administered) and four doses of PFOS (10 mg/kg/total dose, orally gavaged). (E) Flow cytometry analysis of neutrophils isolated from the colon lamina propria. CD45+ cells were gated out for analysis of Ly6C and Ly6G. Neutrophils are gated as Ly6Cint and Ly6G+. n=5-11, three experiments. (F) Violin plots showing neutrophil frequencies out of CD45+ cells and absolute numbers. (G) Body weight loss curves from mice treated with TNBS and PFOS. (H) Representative H&E microscopy images of distal colons from mice treated with TNBS and PFOS. Scale bars: 50 µm. (I) Violin plots showing histological scores quantified from H&E staining of colon sections as shown in H. n=5-11, three experiments. *P<0.05, **P<0.01, ***P<0.001. One-way ANOVA with Fisher's LSD test.