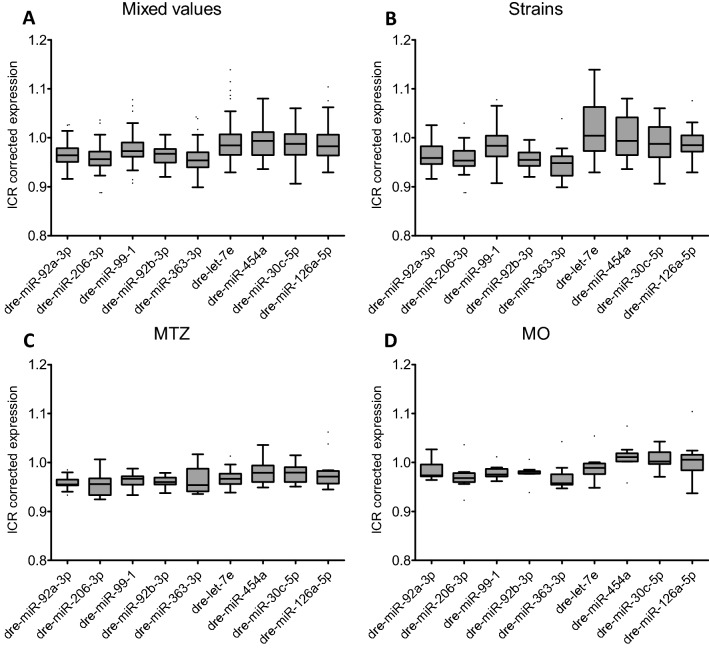
IMAGE

Figure 3

ID
ZDB-IMAGE-211201-14
Source
Figures for Siegerist et al., 2021
Image
Figure Caption

Figure 3

Abundant expression of candidate as endogenous control miRs. All miR candidates were detectable in the whole sample set. In general, they exhibit a high homogeneity as indicated by low standard deviations (SD). MiR-92b-3p shows most homogenous expression levels in mixed values (A), strains only (B), MTZ-treatment group (C) and in MO-treated group (D). Data is presented as inter-run calibrator (ICR) corrected expression. Box-Whisker plots with upper and lower quartiles and outliers from technical triplicates. (A) 45 samplings of 20 pooled larvae; (B) 21 samplings of 20 pooled larvae; (C) 15 samplings of 20 pooled larvae; (D) 9 samplings of 20 pooled larvae.

Acknowledgments
This image is the copyrighted work of the attributed author or publisher, and ZFIN has permission only to display this image to its users. Additional permissions should be obtained from the applicable author or publisher of the image. Full text @ Sci. Rep.