
|
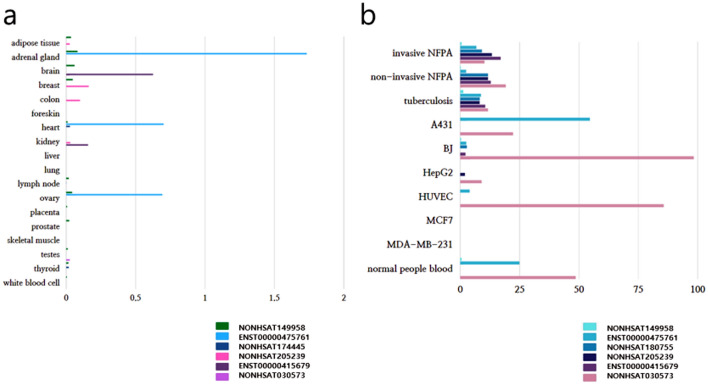
Figure 4 The human tissue expression profiles represented by FPKM/TPM (a) and exosome expression profiles represented by FPKM (b) were evaluated on 8 conserved lncRNAs. invasive NFPAs, invasive nonfunctional pituitary adenomas exosomes; non-invasive NFPAs, non-invasive nonfunctional pituitary adenoma exosomes; tuberculosis, active tuberculosis patient serum exosomes; A431, squamous cell carcinoma cell line exosomes; BJ, foreskin fibroblast cell line exosomes; HepG2, hepatocellular carcinoma cell lines; MCF7, human breast cancer cell line exosomes; MDA-MB-23a, human breast cancer cell line exosomes; normal people blood, normal people blood exosomes (http://www.noncode.org/).