
Image
|
Figure Caption
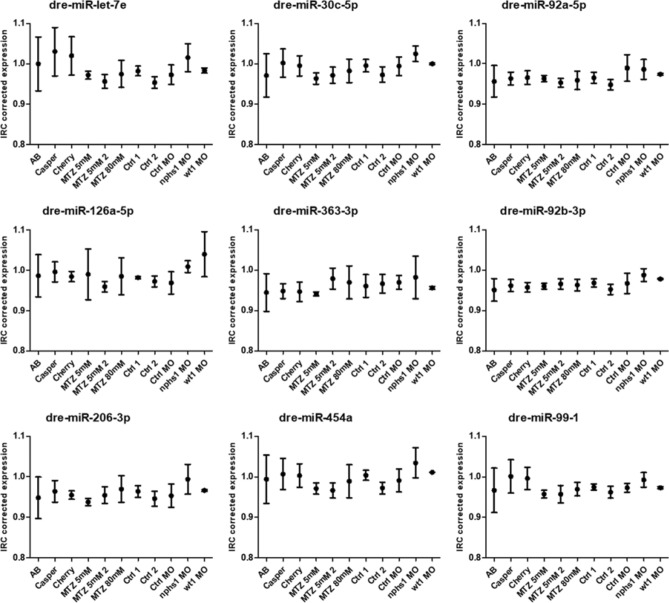
Figure 6
Differences in candidate miR expression between different subgroups. There are no significant differences between the presented subgroups. Data is presented as inter-run calibrator (ICR) corrected expression. All values are shown as mean from technical triplicates. Error bars = SD.
Acknowledgments
This image is the copyrighted work of the attributed author or publisher, and
ZFIN has permission only to display this image to its users.
Additional permissions should be obtained from the applicable author or publisher of the image.
Full text @ Sci. Rep.