
|
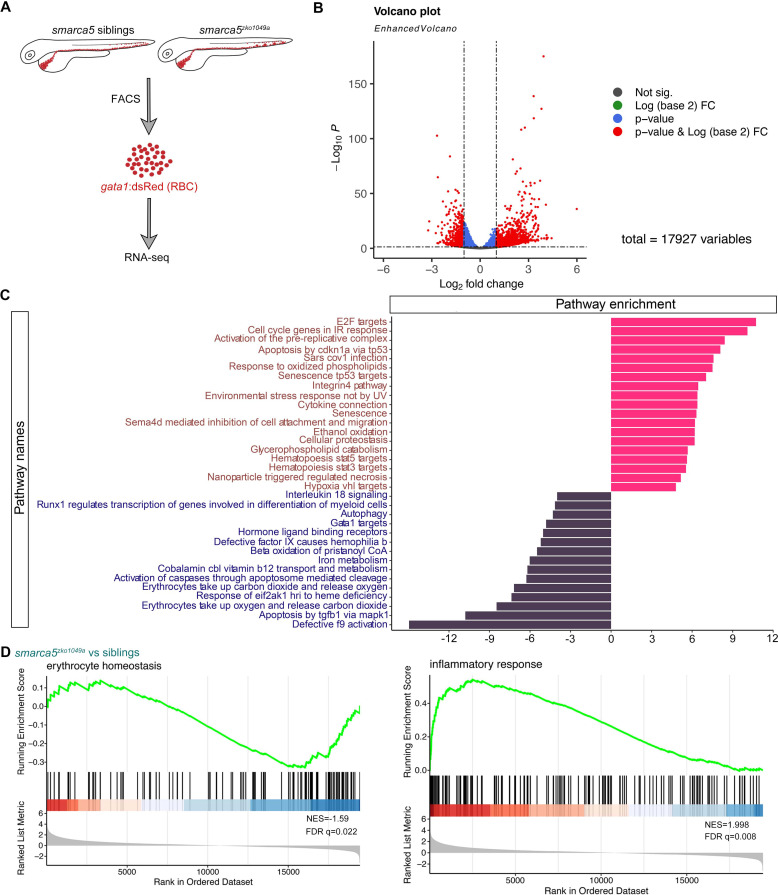
Figure 4
(A) Schematic representation of the RBC RNA-seq workflow in smarca5zko1049a and their siblings at 2 dpf. (B) Volcano plot showing differential expression genes between RBCs from smarca5zko1049a and their siblings by DESeq2. −Log10 P, negative log10 adjusted p-value. Adjusted p-value < 0.05, log2 fold change >1. (C) Differential pathways enriched in RBCs from smarca5zko1049a and their siblings by GSVA. The x axis represents the t values of GSVA scores. Two-sided unpaired limma-moderated t test. (D) Enrichment plots for the top pathways in the mutant RBCs by GSEA (Gene Set Enrichment Analysis).
Transcriptional disruption of genes related to erythrocyte function and homeostasis after smarca5 deletion.