
Fig 2
- ID
- ZDB-IMAGE-211116-18
- Publication
- Mendonca et al., 2021 - Origami: Single-cell 3D shape dynamics oriented along the apico-basal axis of folding epithelia from fluorescence microscopy data
- All Figures
- Figures for Mendonca et al., 2021
|
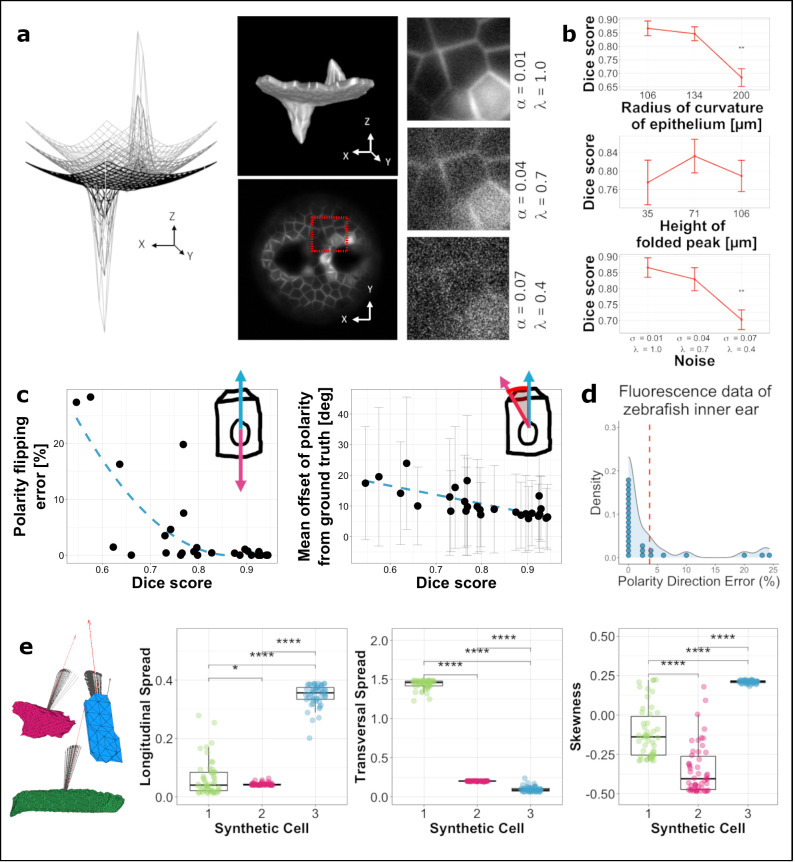
Fig 2
a. Surface meshes of synthetic epithelia for validating the Origami analysis pipeline. Alongside, 3D rendering of one of the synthetic epithelia (top) and a single 2D slice through it (bottom). Each image volume was corrupted with three levels of noise. b. The relationship between surface geometry/noise and segmentation quality. Error bars represent the standard deviation. Tukey’s pairwise comparisons with significant values depicted with asterisks: Dice score at radius of curvature of 200 μm (1000 pixels) compared to that at 106 μm (530 pixels)–