
|
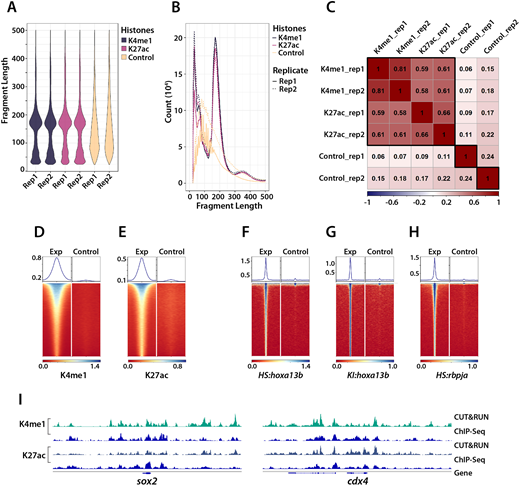
Fig. 2 Quality assessment of CUT&RUN. (A,B) CUT&RUN fragment size distribution. Plots showing the proportion of DNA for each fragment size (A) and raw number of fragments by size (B). Both biological replicates (rep) are shown in A and B. The histone mark samples show strong enrichment of mononucleosome-sized fragments, whereas the control samples show a random size distribution. (C) Assessment of replicate reproducibility. The genome was subdivided into 500 bp bins; the reads for each sample in each bin were assessed and then subjected to correlation analysis between the samples. The high correlation between the replicates of the histone modification samples shows the reproducibility of the CUT&RUN experiment. The activating modifications (H3K27ac and H3K4me1) were generally well correlated. (D-H) Heatmaps (bottom) and plots (top) showing the signal within ±1 kb of the CUT&RUN peak summit center for both the experimental (Exp) and control samples. (I) comparison of CUT&RUN results (light green and dark green tracks) to previous ChIP-Seq data (blue tracks) for two posteriorly expressed genes, sox2 and cdx4.