
|
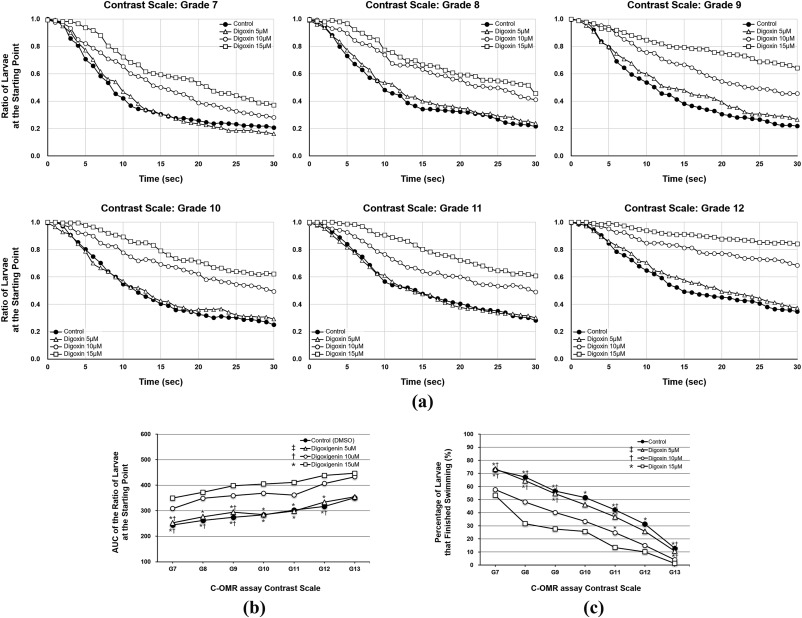
Fig. 2 The ratio of larvae at the starting point curve (A), the area under the curve (AUC) of the ratio of larvae at the starting point curve (B), and the percentage of larvae that finished swimming (C) according to the contrast-optomotor response assay after 24 h exposure at 4 dpf to 0 (control), 5, 10, 15 μM digoxin. Asterisk (∗) indicates a P value < 0.05 compared with the Digoxin 15 μM group, dagger (†) indicates a P value < 0.05 compared with the Digoxin 10 μM group, and double dagger (‡) indicates a P value < 0.05 compared with the Digoxin 5 μM group by the one-way ANOVA with post-hoc Tukey HSD test.