IMAGE

Fig. 3

ID
ZDB-IMAGE-211011-26
Genes
Source
Figures for Ellingsen et al., 2021
Image
Figure Caption

Fig. 3

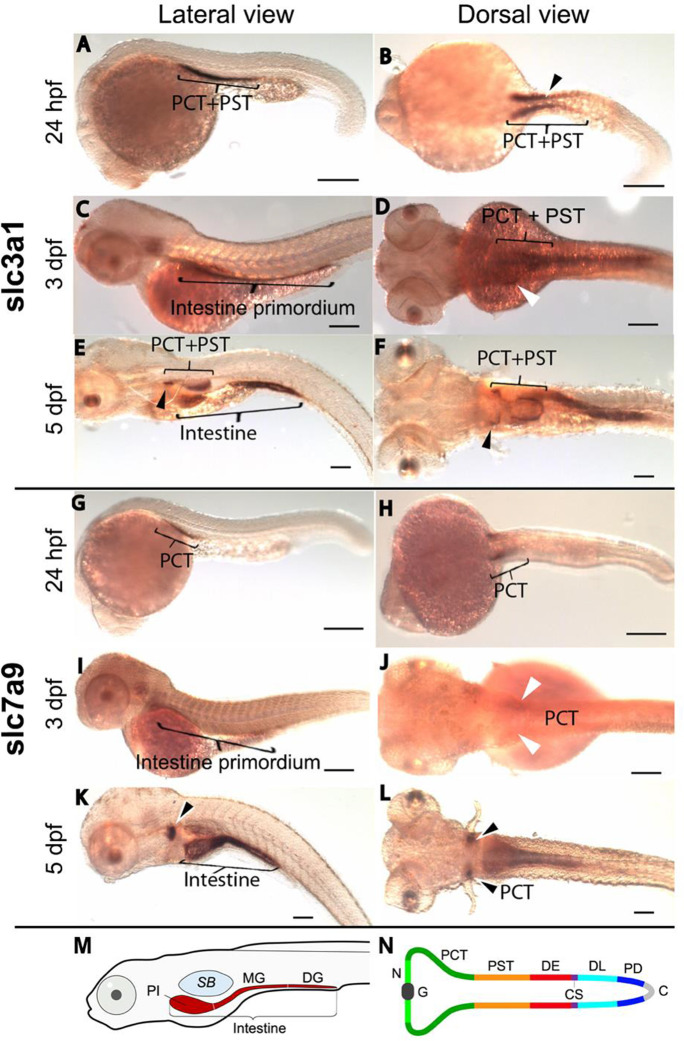
Spatiotemporal distribution of rBAT/slc3a1 and b0,+AT/slc7a9. Whole-mount in situ hybridization of wild-type embryos. (A) Lateral view shows expression of slc3a1 in proximal convoluted tubule (PCT) and proximal straight tubule (PST) segments of the nephron at 24 hpf. (B) Dorsal view shows two parallel stripes of slc3a1 expression at 24 hpf in the pronephros-spanning regions of PCT and PST. (C) Lateral view shows slc3a1 expression in intestinal primordium at 3 dpf. (D)slc3a1 expression at 3 dpf is also observed in the PCT and PST in the dorsal view. (EF)slc3a1 expression in the intestine, PCT, and PST at 5 dpf. (G) Lateral view and (H) dorsal view show the slc7a9 expression only in the PCT at 24 hpf. At 3 dpf, slc7a9 expression is seen in the intestinal primordium (I) and PCT (J). At 5 dpf, slc7a9 expression is seen in the PCT (K-L) and intestine (K–L). Arrowhead in B indicates putative region between PCT and PST. Arrowheads in D, E, F, J, K, and L indicate PCT expression domains (scale bar: 100 µm). M Schematic lateral view of primordial intestine at 5 dpf; with proximal intestine (PI), midgut (MG) and distal gut (DG). SB, swim bladder. N Schematic dorsal view of nephrons with segments indicated: glomerolus (G), neck (N), distal early (DE), corpuscle of Stannius (CS), distal late (DL), and pronephric duct (PD), cloaca (C) (modified from Wingert et al. 2007). Abbreviations: hpf, hours post fertilization; dpf, days post fertilization

Figure Data
Acknowledgments
This image is the copyrighted work of the attributed author or publisher, and ZFIN has permission only to display this image to its users. Additional permissions should be obtained from the applicable author or publisher of the image. Full text @ Fish Physiol. Biochem.